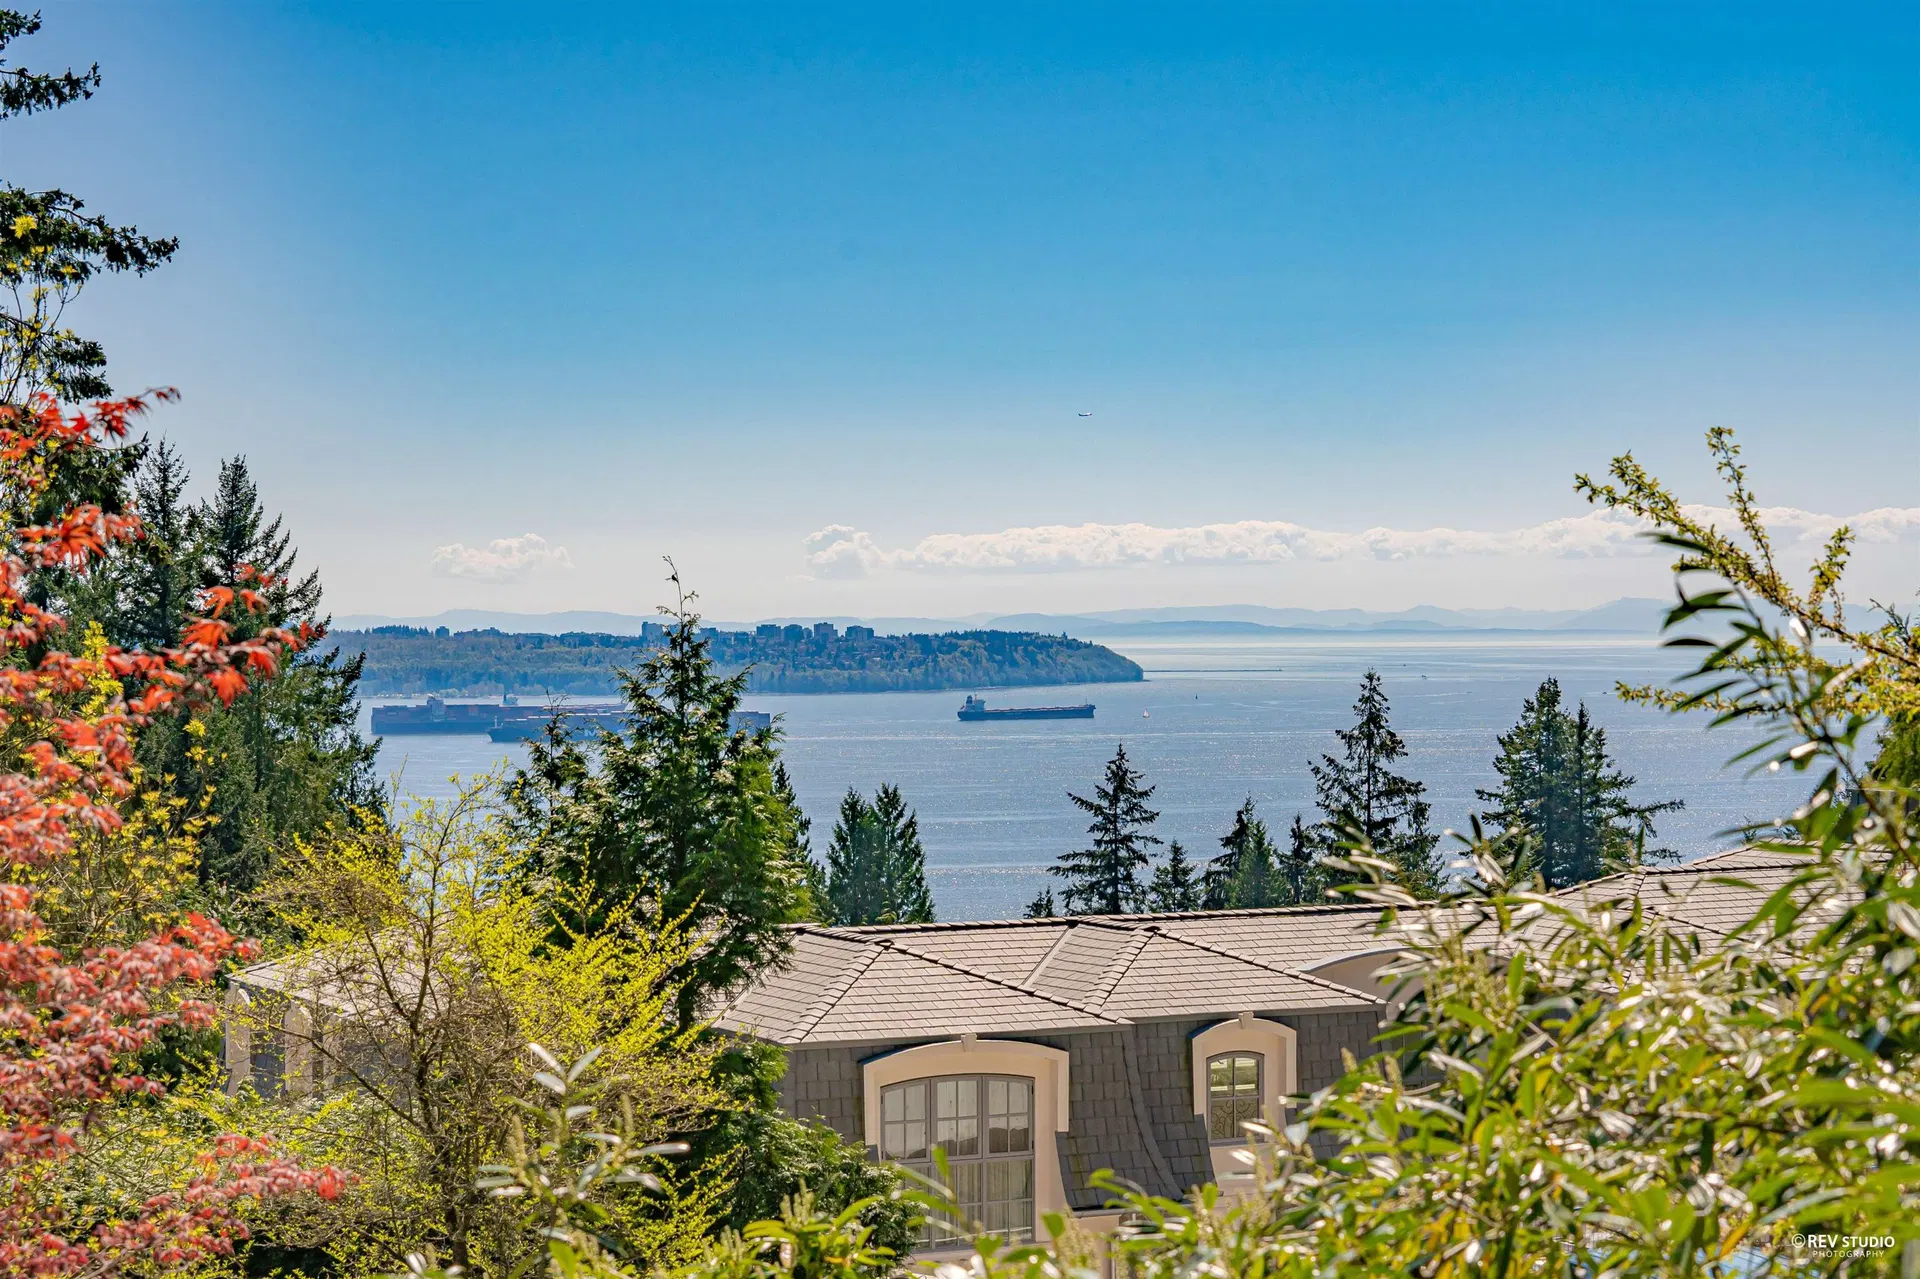
36
$2,377,000
$880/sqft
3 bd · 4 ba · 2,702 sqft
2261 Gisby Street
West Vancouver · Single Family Residence
Listed by Homeland RealtyMLS® R3174020
West Vancouver neighbourhood
14 listings, median $6,448,000. 115% above the West Vancouver median.
Open these Altamont homes on the map
Draw an area and save homes you like.
$2,377,000
$880/sqft
3 bd · 4 ba · 2,702 sqft
2261 Gisby Street
West Vancouver · Single Family Residence
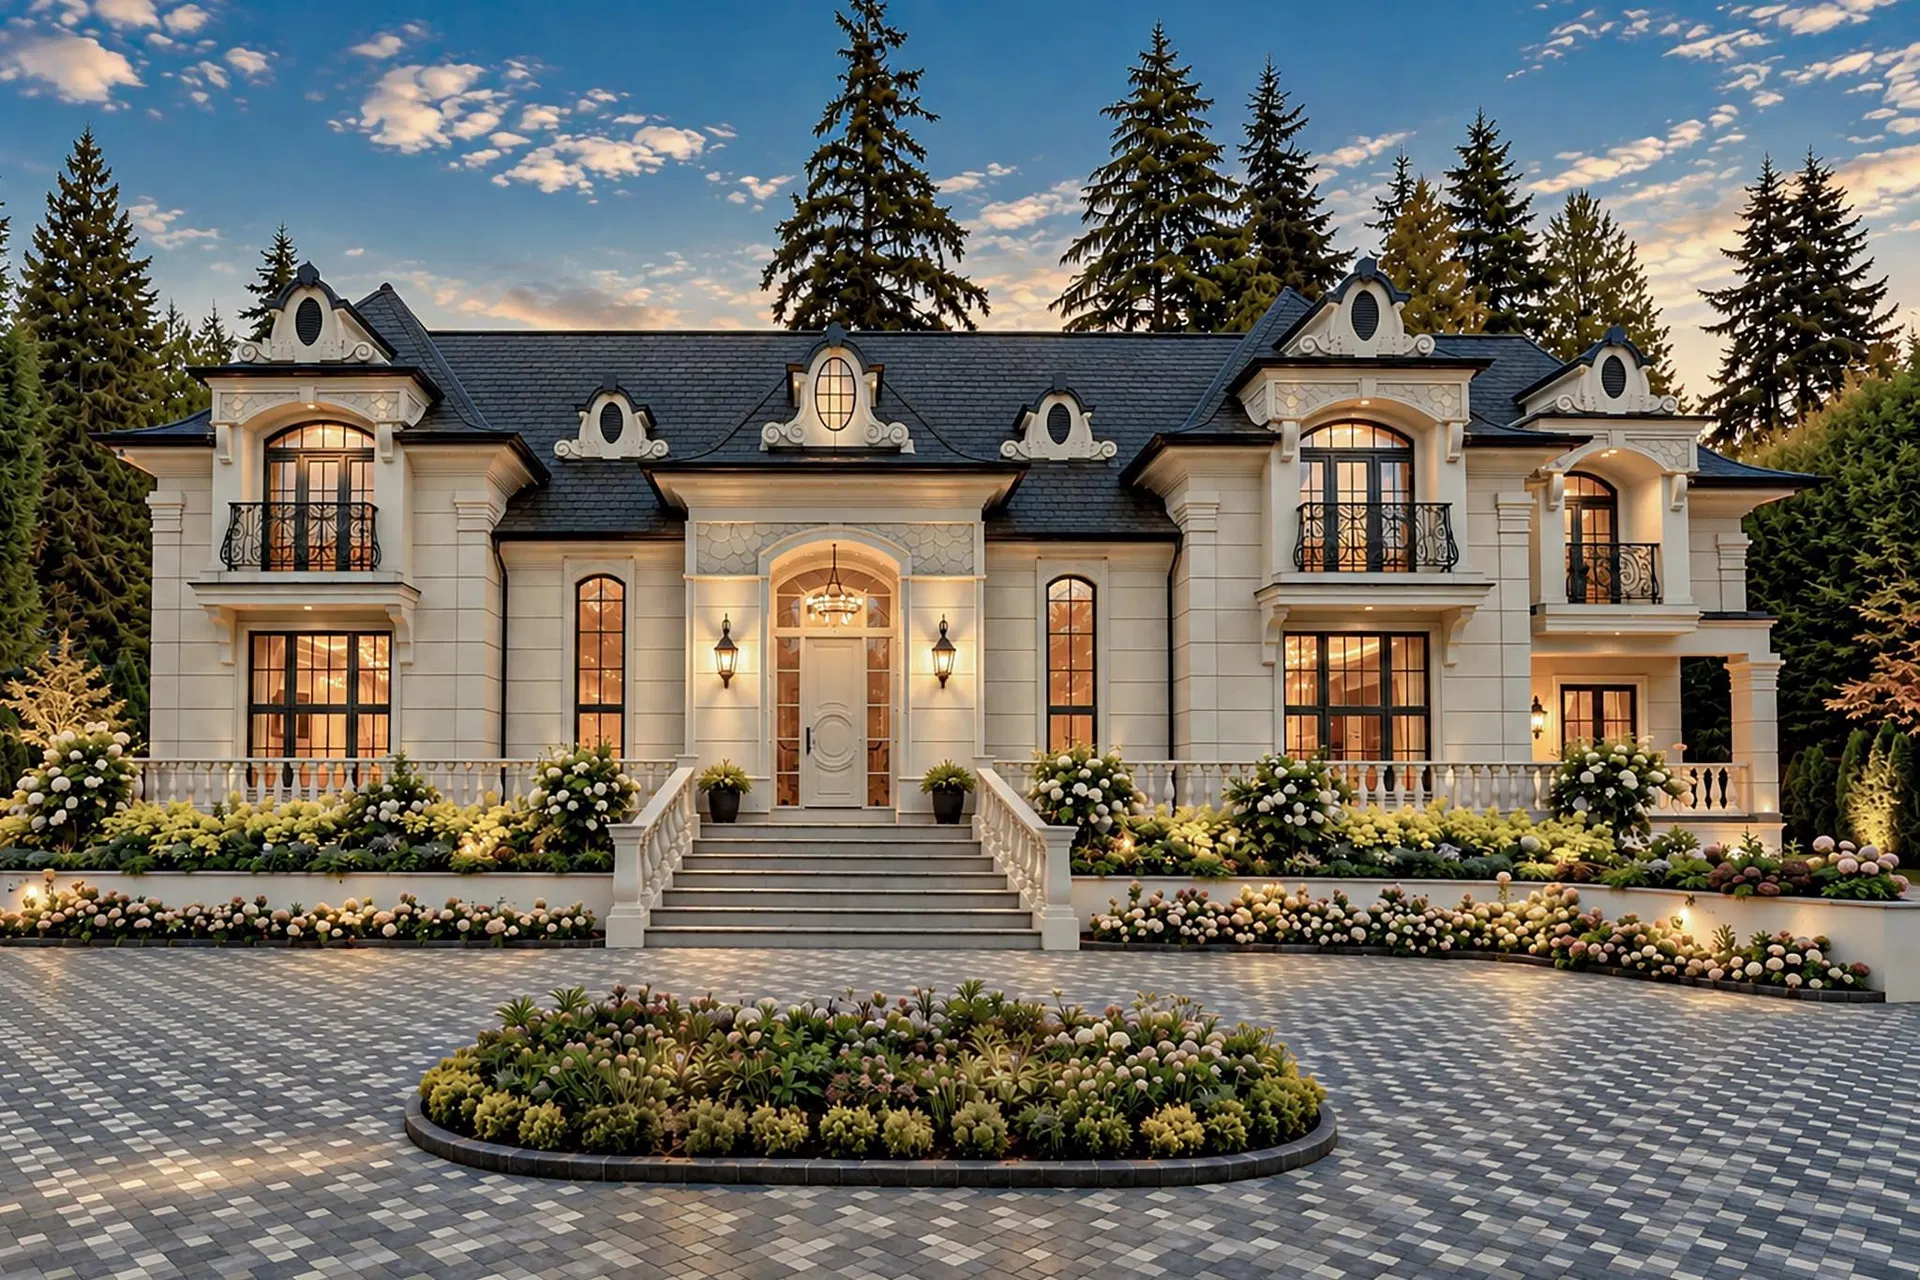
$26,800,000
$1,515/sqft
8 bd · 12 ba · 17,687 sqft
2867 Marine Drive
West Vancouver · Single Family Residence
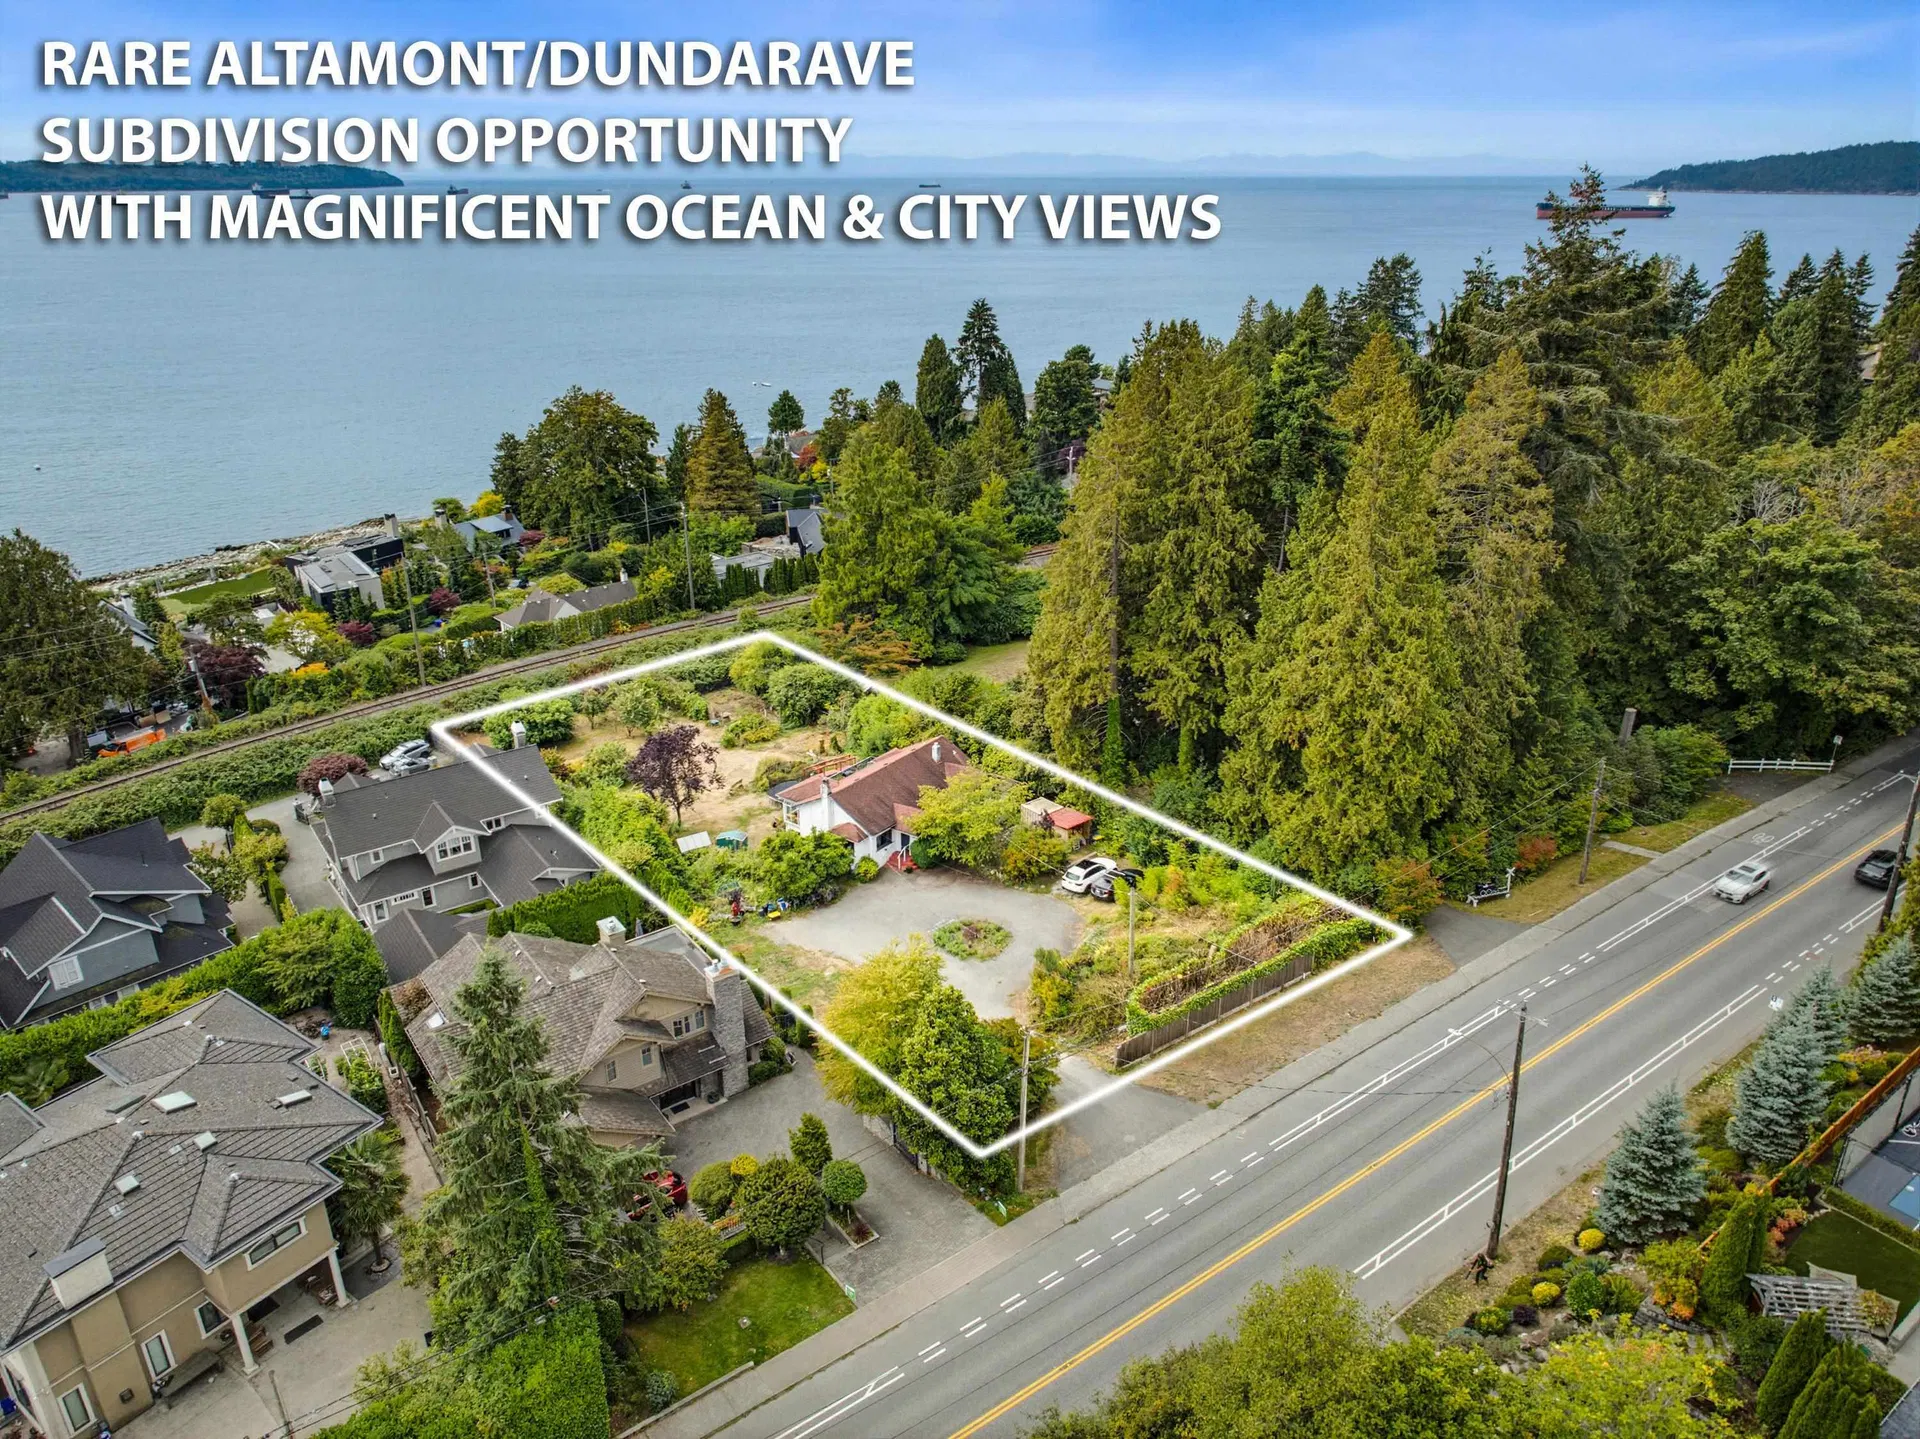
$5,998,000
$2,315/sqft
6 bd · 3 ba · 2,591 sqft
2820 Marine Drive
West Vancouver · Single Family Residence
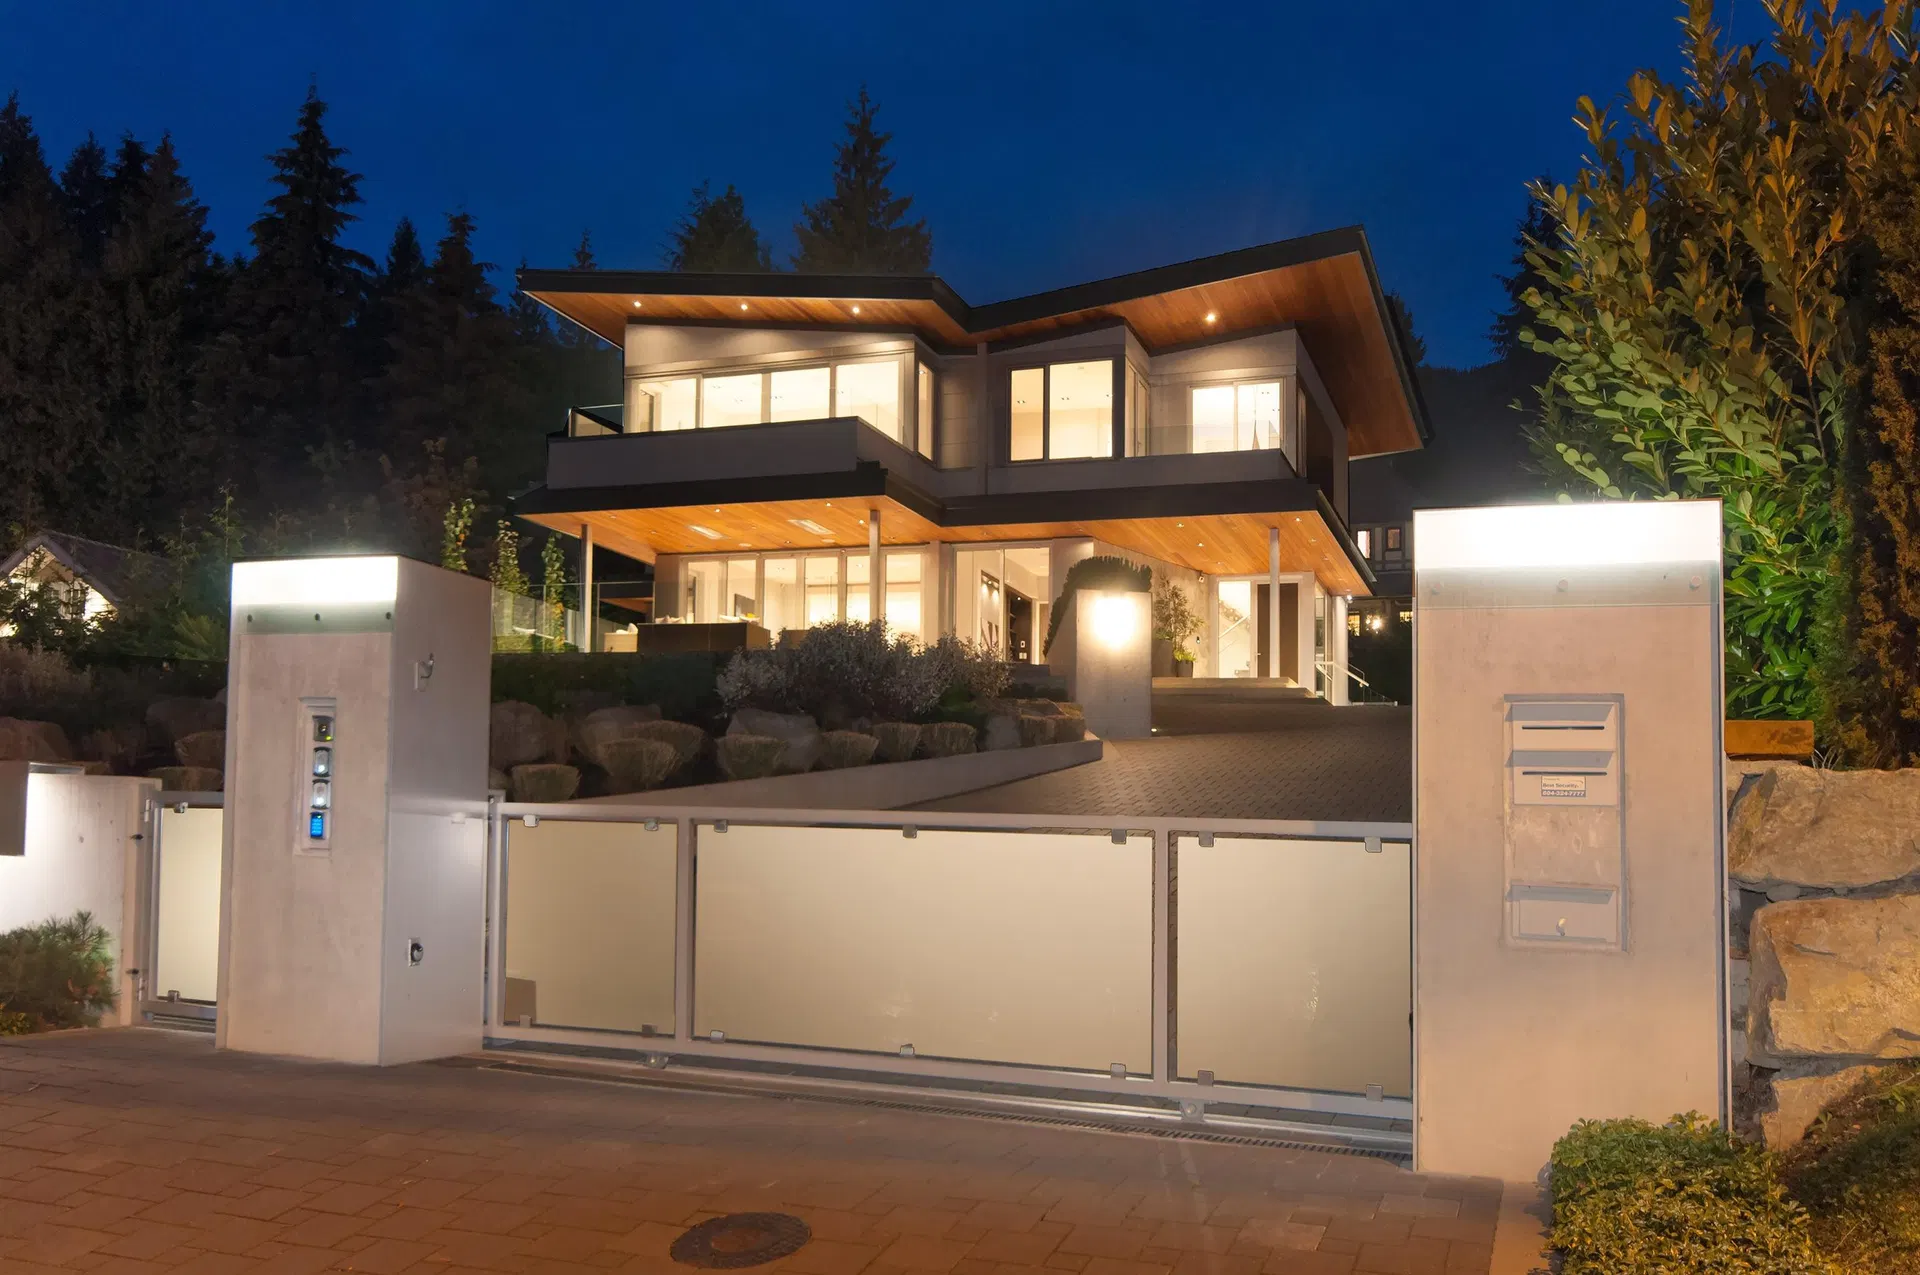
$6,398,000
$1,144/sqft
7 bd · 6 ba · 5,594 sqft
3023 Mathers Avenue
West Vancouver · Single Family Residence
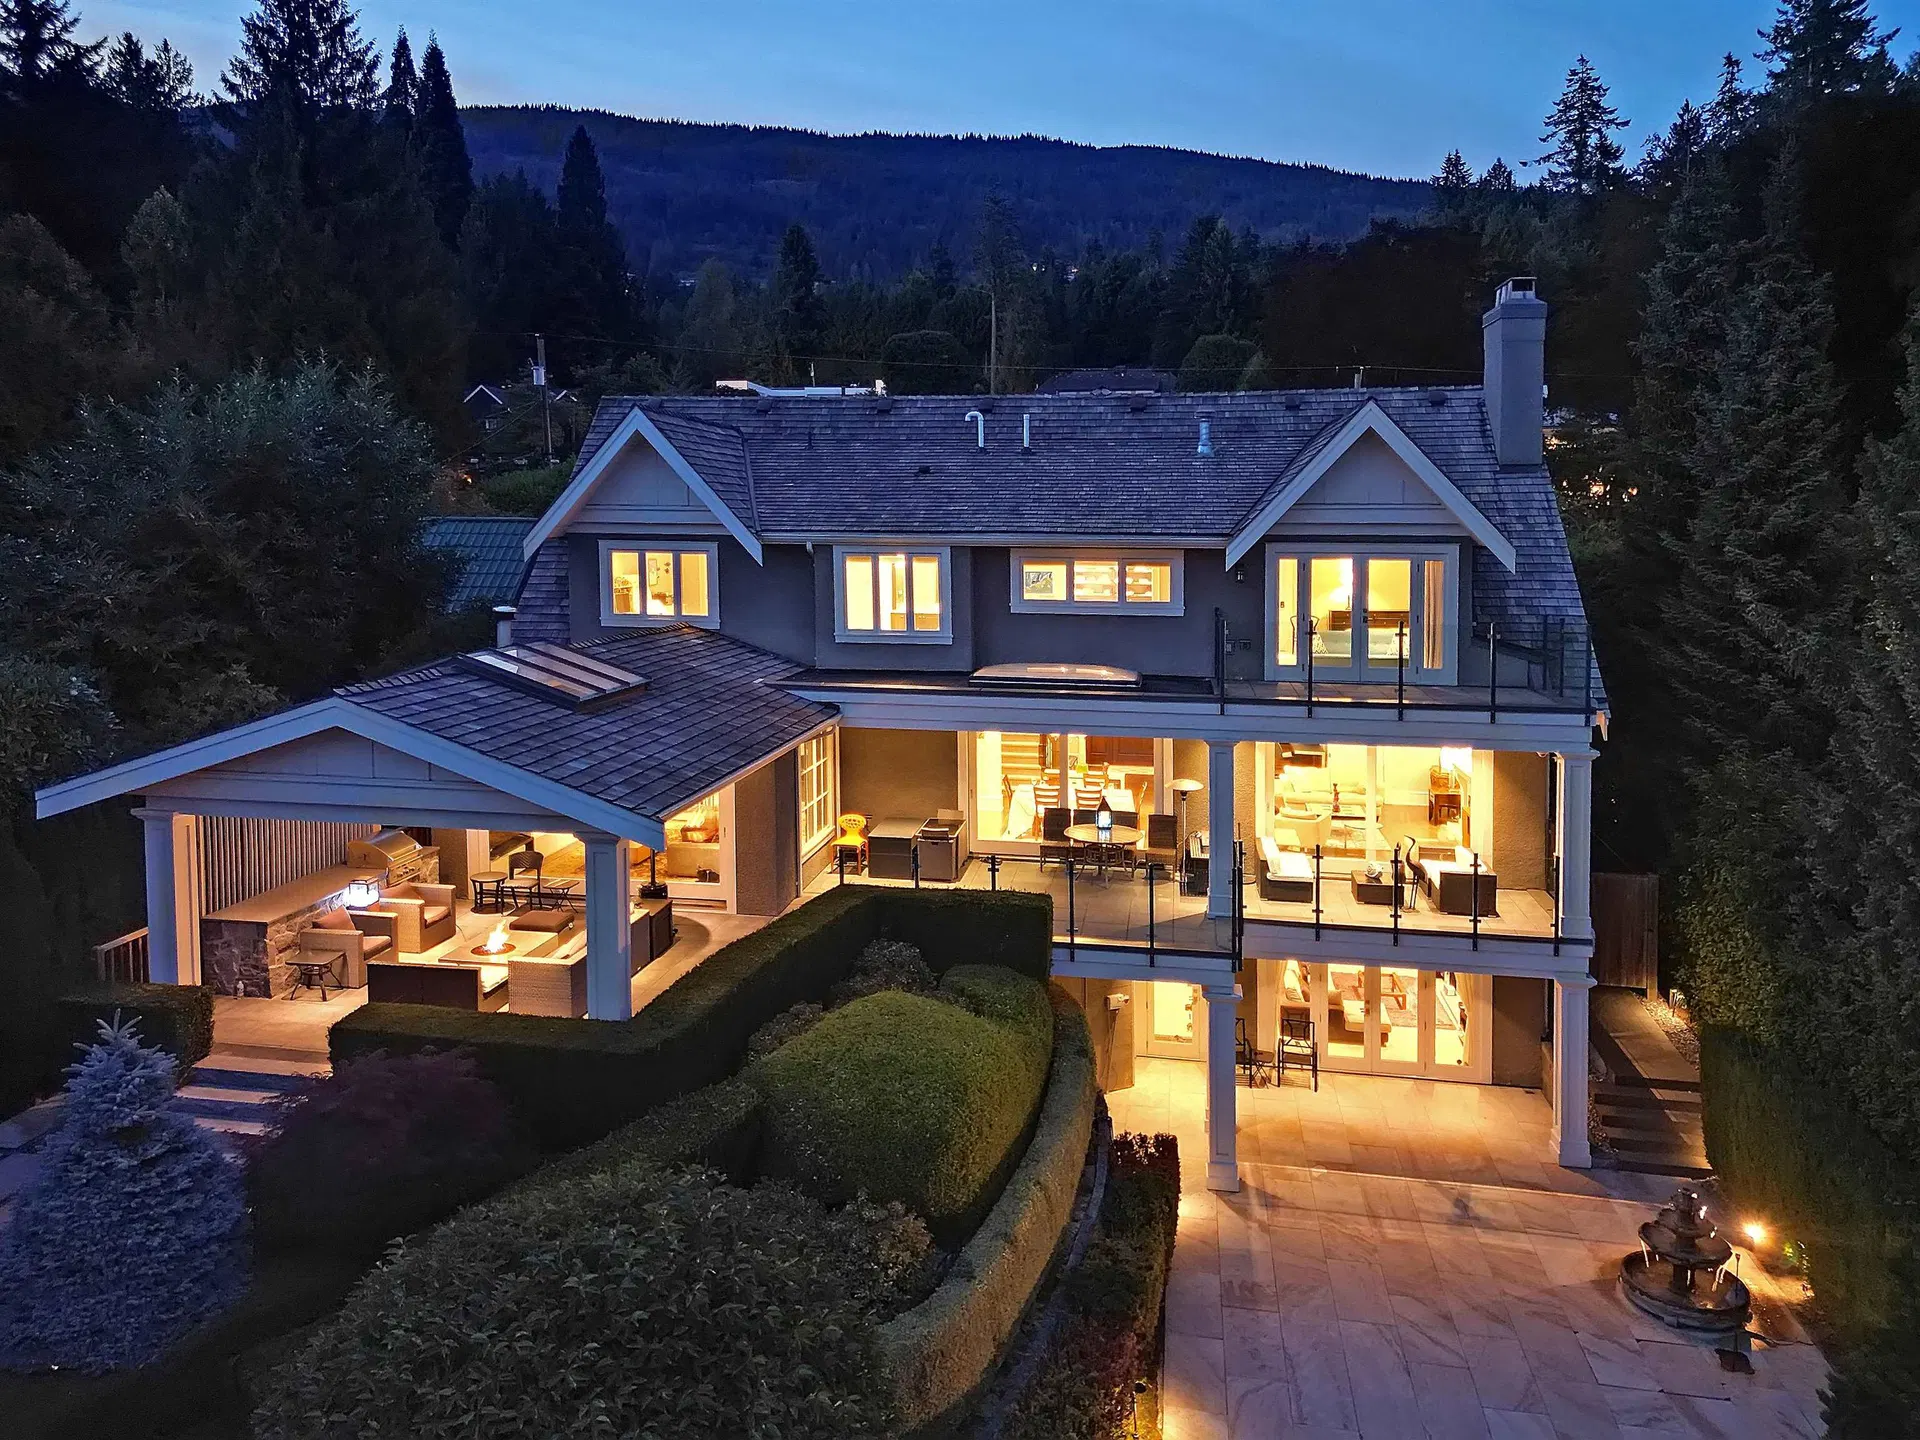
$7,980,000
$1,256/sqft
5 bd · 7 ba · 6,351 sqft
2920 Mathers Avenue
West Vancouver · Single Family Residence
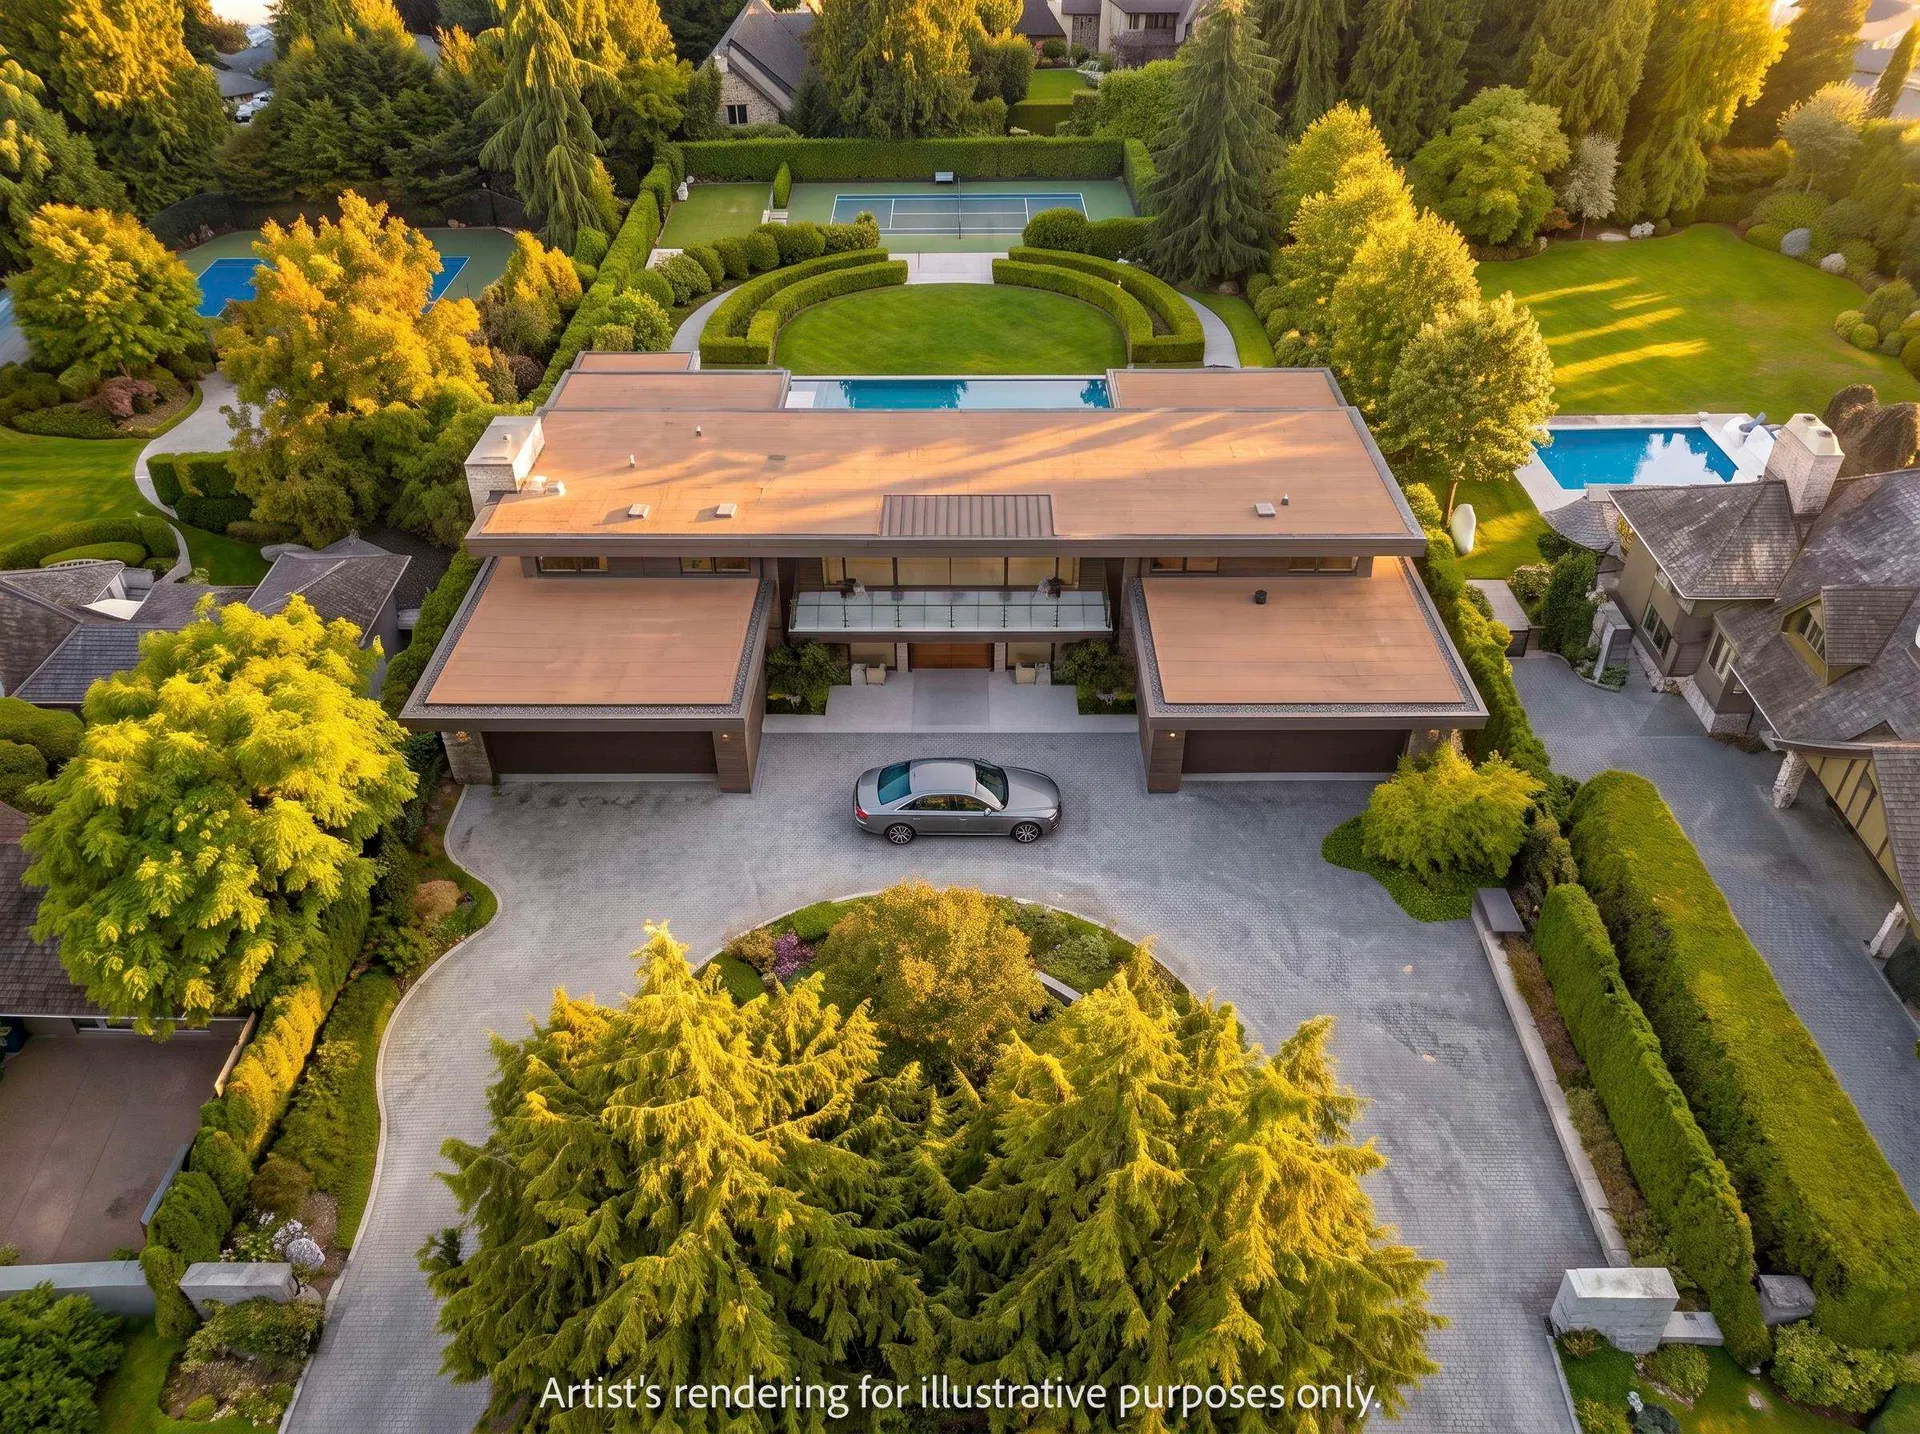
$6,498,000
2976 Palmerston Avenue
West Vancouver · Land
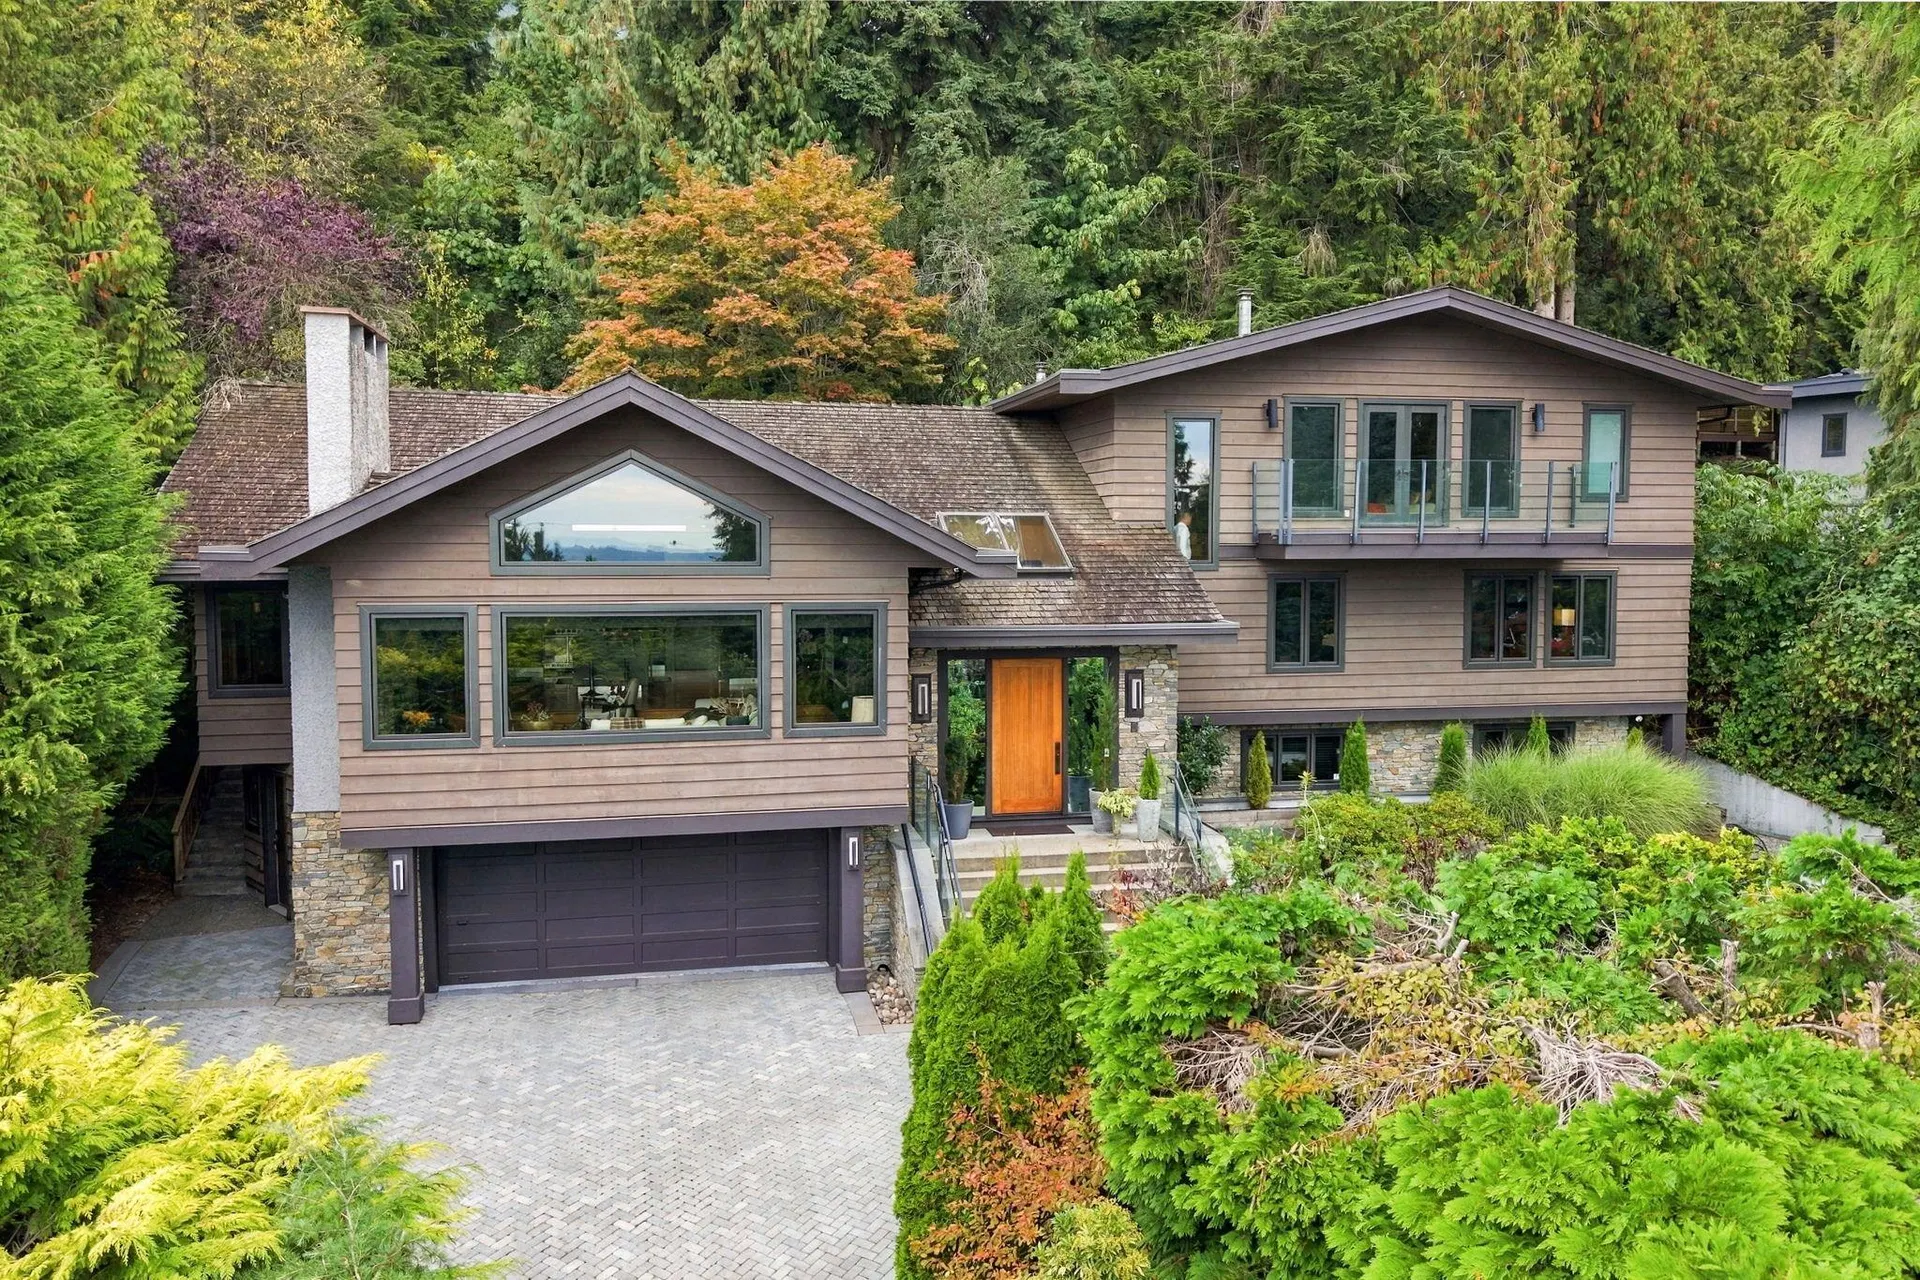
$4,499,000
$843/sqft
5 bd · 5 ba · 5,340 sqft
2953 Altamont Crescent
West Vancouver · Single Family Residence

$9,388,000
$1,372/sqft
5 bd · 7 ba · 6,843 sqft
2965 Altamont Crescent
West Vancouver · Single Family Residence
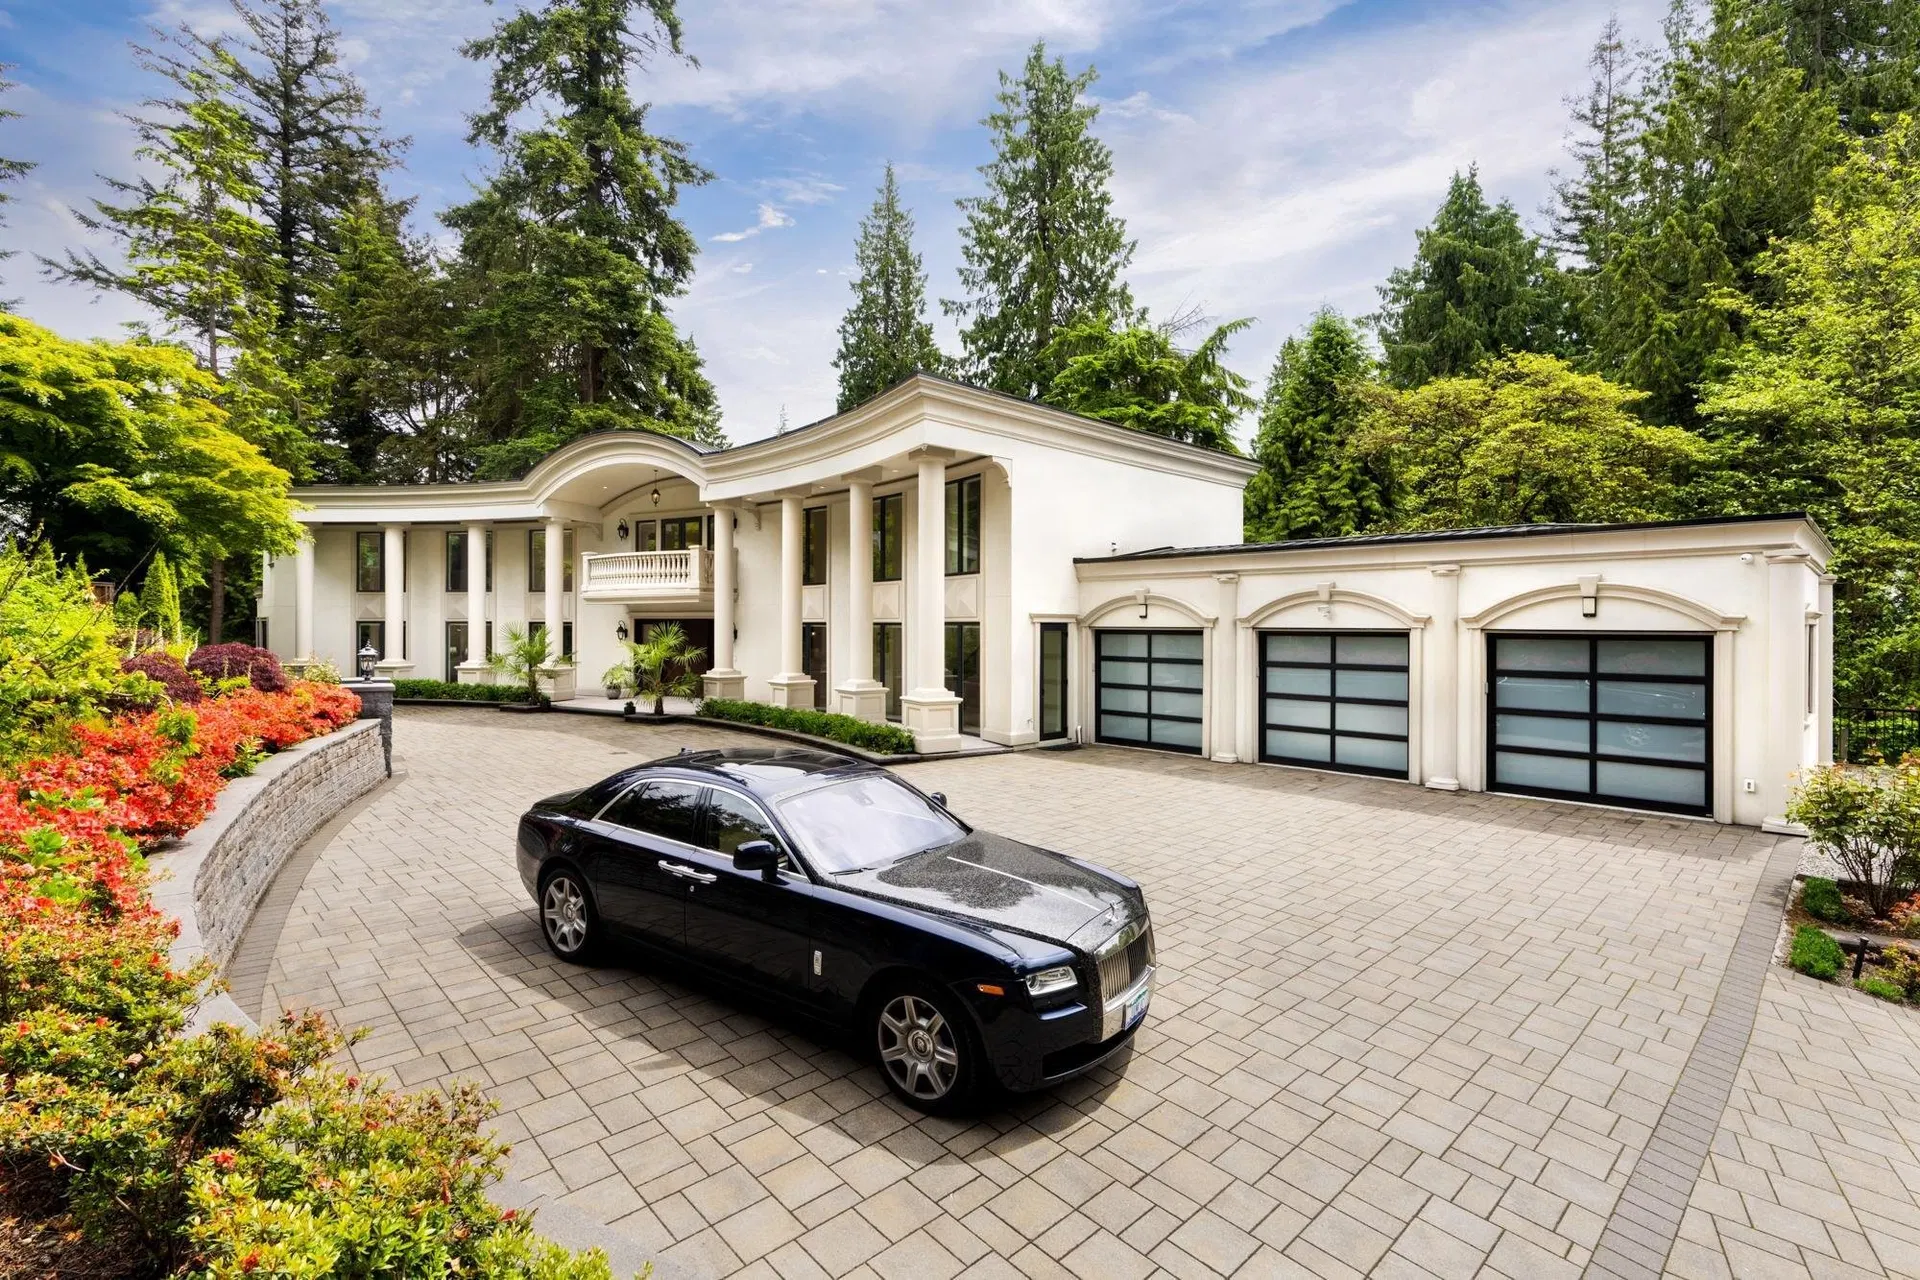
$9,998,000
$865/sqft
7 bd · 10 ba · 11,557 sqft
1760 29th Street
West Vancouver · Single Family Residence

$4,788,000
$823/sqft
6 bd · 6 ba · 5,820 sqft
1408 31st Street
West Vancouver · Single Family Residence
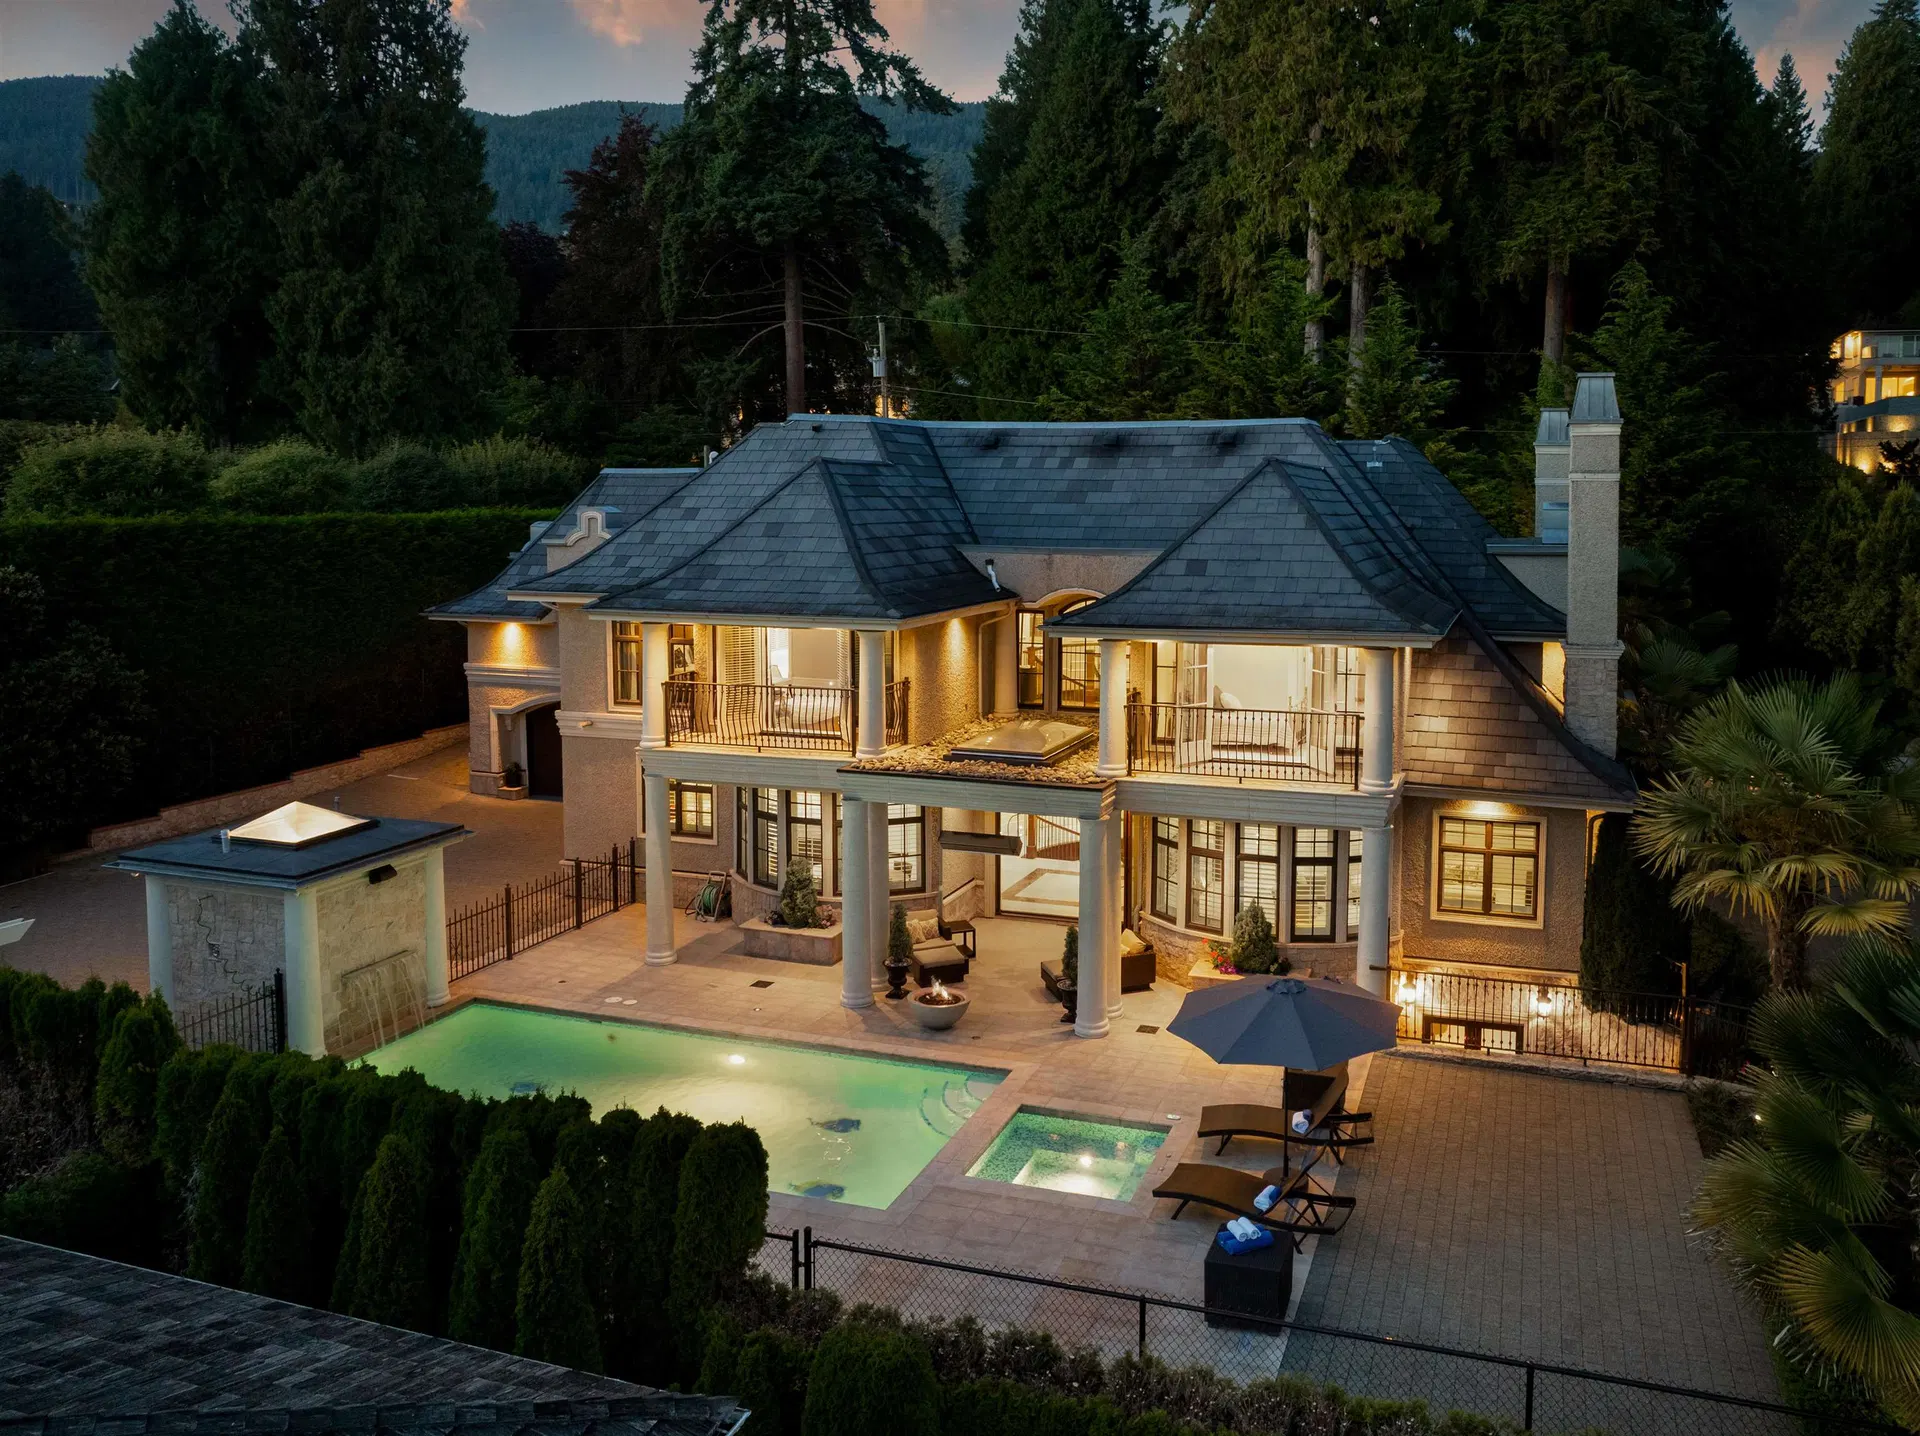
$7,998,000
$882/sqft
7 bd · 7 ba · 9,067 sqft
2912 Mathers Avenue
West Vancouver · Single Family Residence

$5,950,000
$979/sqft
5 bd · 4 ba · 6,079 sqft
2975 Marine Drive
West Vancouver · Single Family Residence
NOTE: This representation is based in whole or in part on data generated by the Chilliwack & District Real Estate Board, Fraser Valley Real Estate Board or Real Estate Board of Greater Vancouver which assumes no responsibility for its accuracy. The information contained on this site is based in whole or in part on information that is provided by members of The Canadian Real Estate Association (CREA), who are responsible for its accuracy. CREA reproduces and distributes this information as a service for its members and assumes no responsibility for its accuracy. MLS®, Multiple Listing Service®, and REALTOR® are trademarks of the Canadian Real Estate Association (CREA).
Saved search
Get new listings that fit, by email.
Detached listings make up 93% of what is for sale in Altamont (13 of 14 listings), with a median asking price of $6.40M. Land listings are next at 7%, typically asking $6.50M.
For context across West Vancouver: Ambleside (median $2.40M), British Properties (median $4.97M), Cypress Park Estates (median $2.72M). Altamont carries the highest median asking price of this group. Comparing a few adjacent areas is often the fastest way to see whether a listing is priced with its street or against it.
Altamont is a detached-house neighbourhood. 93% of the homes on the market are single-family houses on their own lot, so the supply is set by how many owners decide to sell in a given season.
Construction dates are spread out. The median home for sale dates to 2009, with most of the market falling between 1941 and 2022, so condition and updates vary a lot from listing to listing.
15% of the current listings were built in the last five years, so new-construction inventory is a real option here rather than an exception.
85% of the homes for sale have four or more bedrooms, with the 5-bedroom plan the most common of all. Family-sized space is the norm rather than the premium option.
A typical listing here offers about 6,079 sq ft of living space and 6 bathrooms.
Where a lot is reported, the median is 24,219 sq ft, which is what sets the ceiling on additions, laneway homes and future redevelopment.
64% of the listings report a finished basement, which in this city usually means either extra family space or a mortgage helper.
Enclosed parking is standard: 71% of listings include a garage.
Only 0% of the listings in Altamont are strata-titled. Most buyers here are purchasing freehold, with no monthly fee and no strata council to answer to.
There is no rapid-transit station in Altamont, but 71% of the listings are within reach of a frequent bus route.
Across 13 scored listings the median walk score is 35 out of 100, computed from real walking routes. Day-to-day errands here usually involve a drive or a bus.
Cycling scores better than walking in a lot of the city, and it does here too: the median bike score across scored listings is 62.
43% of the homes for sale are close to the water, so seawall and beach access is part of what buyers are paying for.
A view is claimed on 64% of the listings. Views are priced aggressively and are the first thing a new tower can take away, so it is worth checking what protects one before you pay for it.
79% of the listings fall near a top-ranked school catchment, which tends to hold value in this part of the market even when the wider market cools.
Written and maintained by Ray Rasouli, REALTOR®, licensed in British Columbia and founder of Relta Real Estate.
Source: MLS® listing data from BC real estate boards (MLS® Reciprocity) and CREA's DDF®. Figures are asking prices on active MLS® listings filed under this MLS® area. They are not sold prices.
NOTE: This representation is based in whole or in part on data generated by the Chilliwack & District Real Estate Board, Fraser Valley Real Estate Board or Real Estate Board of Greater Vancouver which assumes no responsibility for its accuracy. The information contained on this site is based in whole or in part on information that is provided by members of The Canadian Real Estate Association (CREA), who are responsible for its accuracy. CREA reproduces and distributes this information as a service for its members and assumes no responsibility for its accuracy. MLS®, Multiple Listing Service®, and REALTOR® are trademarks of the Canadian Real Estate Association (CREA).