20
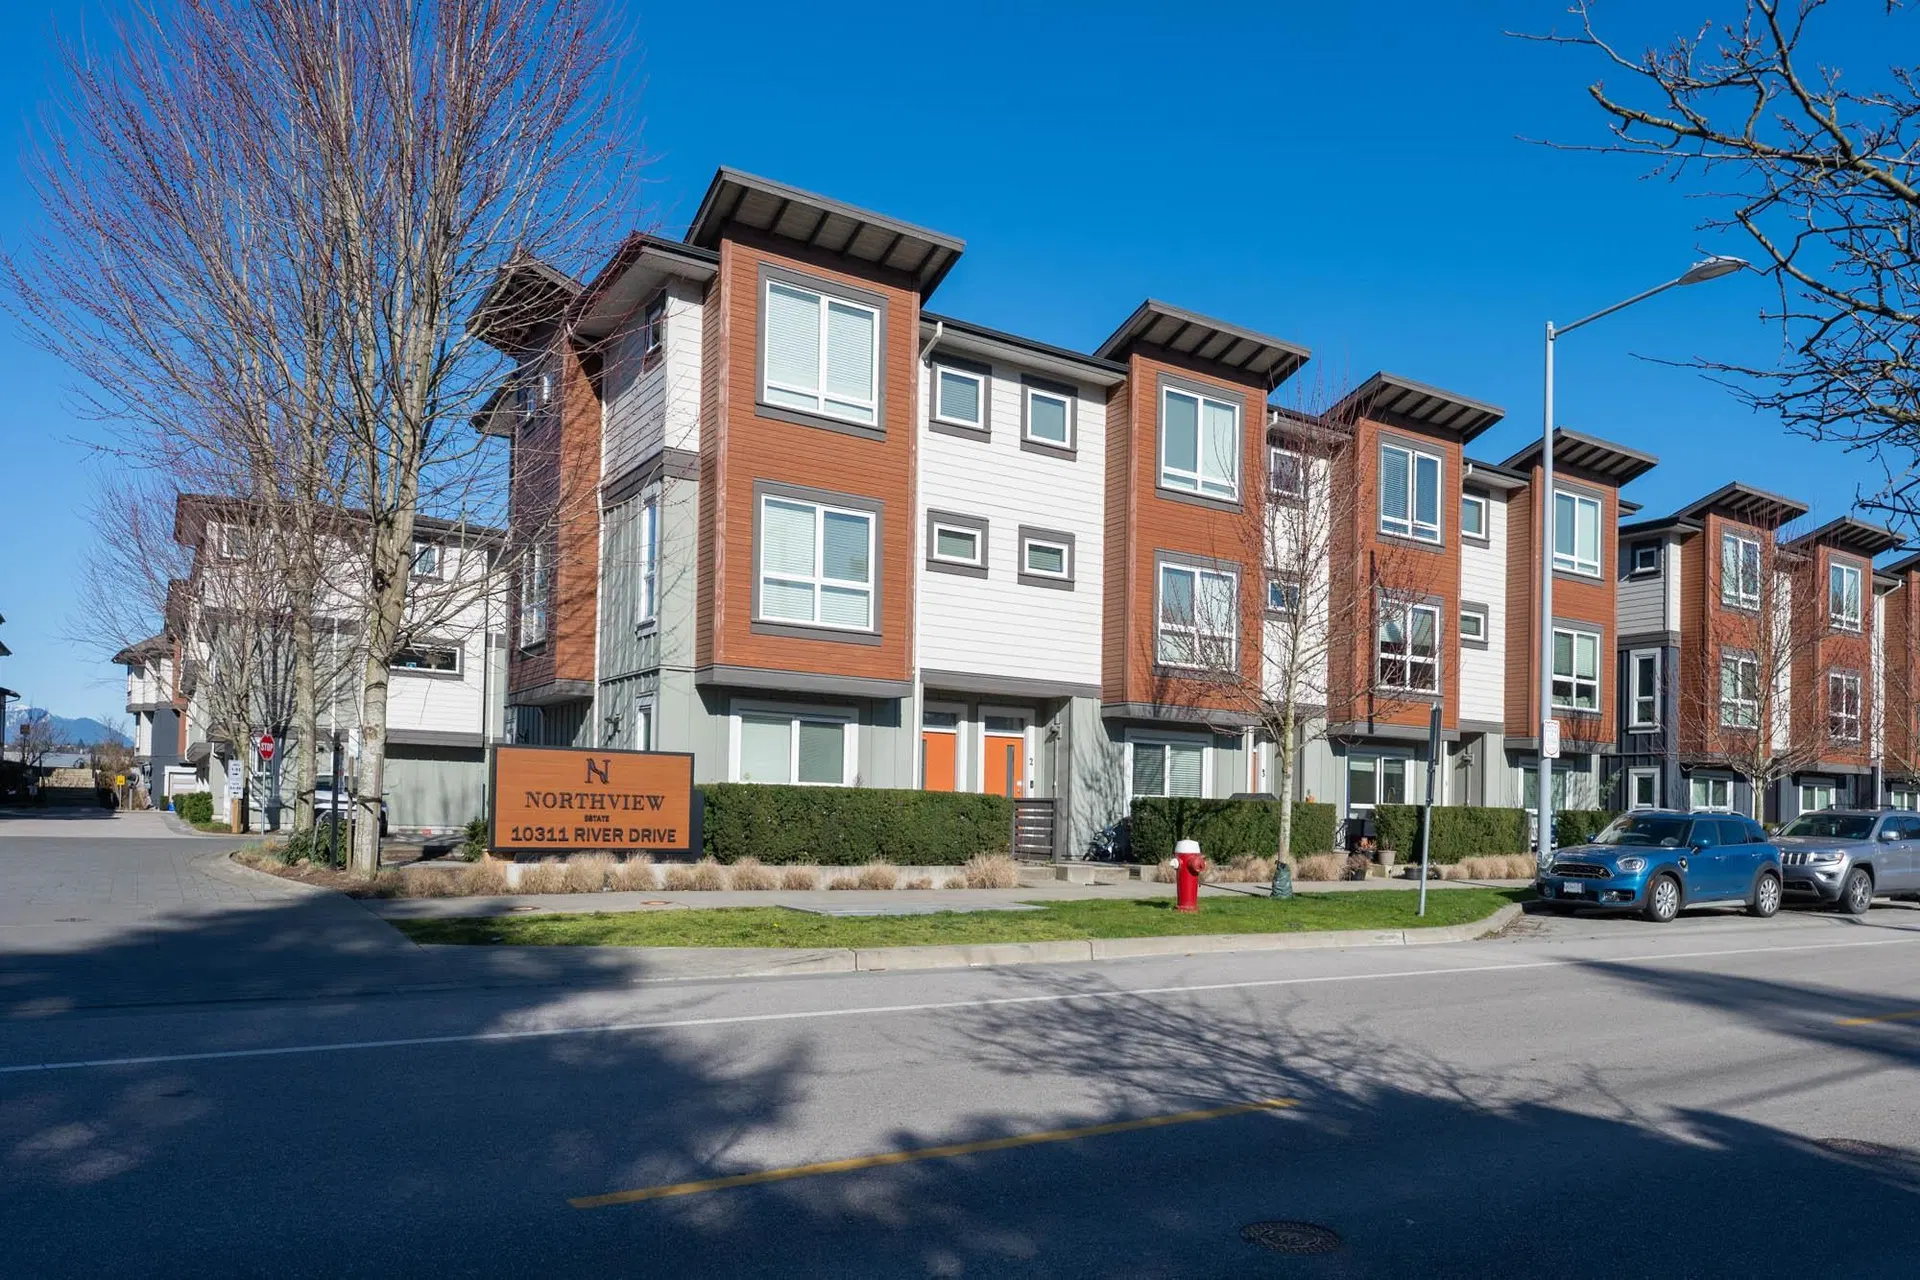
$1,228,800
$846/sqft
3 bd · 3 ba · 1,452 sqft
#84, 10311 River Drive
Richmond · Townhouse
Listed by Coldwell Banker Universe RealtyMLS® R3168072
Richmond neighbourhood
32 listings, median $1,073,950. 7% above the Richmond median.
Open these Bridgeport homes on the map
Draw an area and save homes you like.
$1,228,800
$846/sqft
3 bd · 3 ba · 1,452 sqft
#84, 10311 River Drive
Richmond · Townhouse
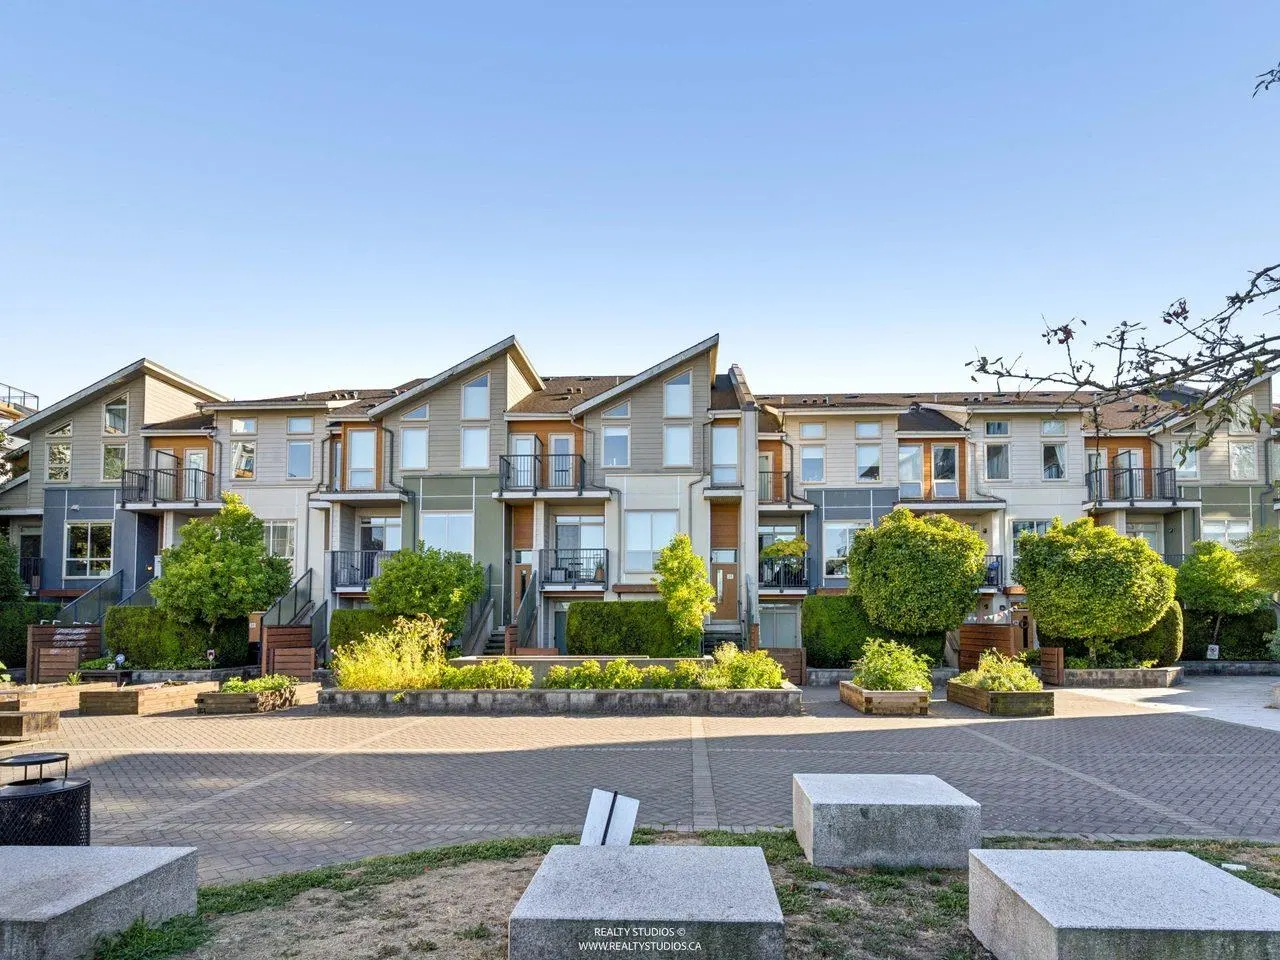
$699,900
$627/sqft
3 bd · 2 ba · 1,116 sqft
#24, 10133 River Drive
Richmond · Townhouse

$628,000
$759/sqft
2 bd · 2 ba · 827 sqft
#502, 10177 River Drive
Richmond · Apartment/Condo
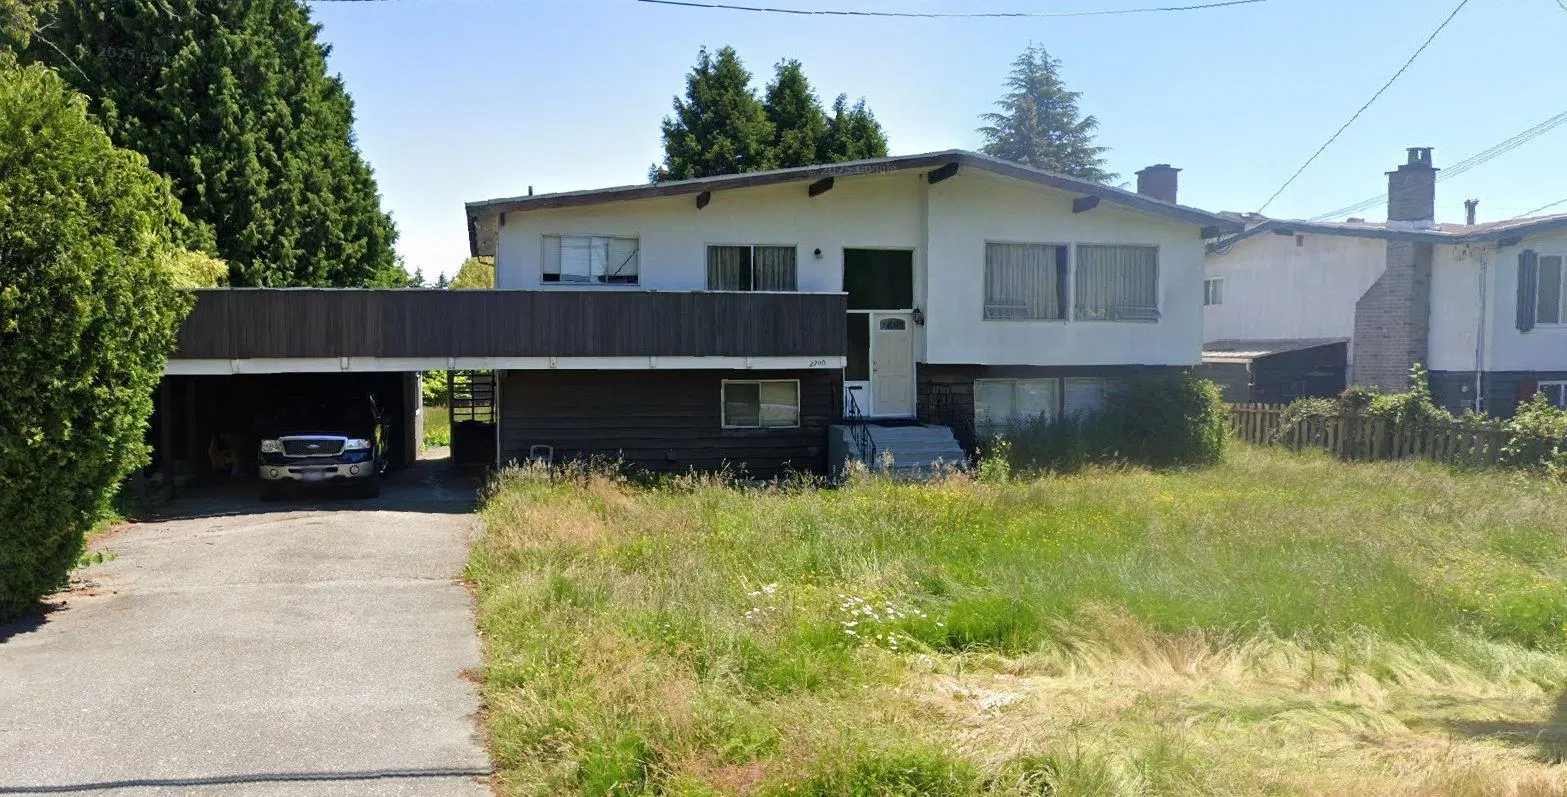
$1,898,000
$745/sqft
4 bd · 3 ba · 2,549 sqft
2200 Mclennan Avenue
Richmond · Single Family Residence

$1,569,900
$540/sqft
5 bd · 3 ba · 2,907 sqft
2271 Baydala Court
Richmond · Single Family Residence

$728,000
$690/sqft
2 bd · 2 ba · 1,055 sqft
#511, 10033 River Drive
Richmond · Apartment/Condo
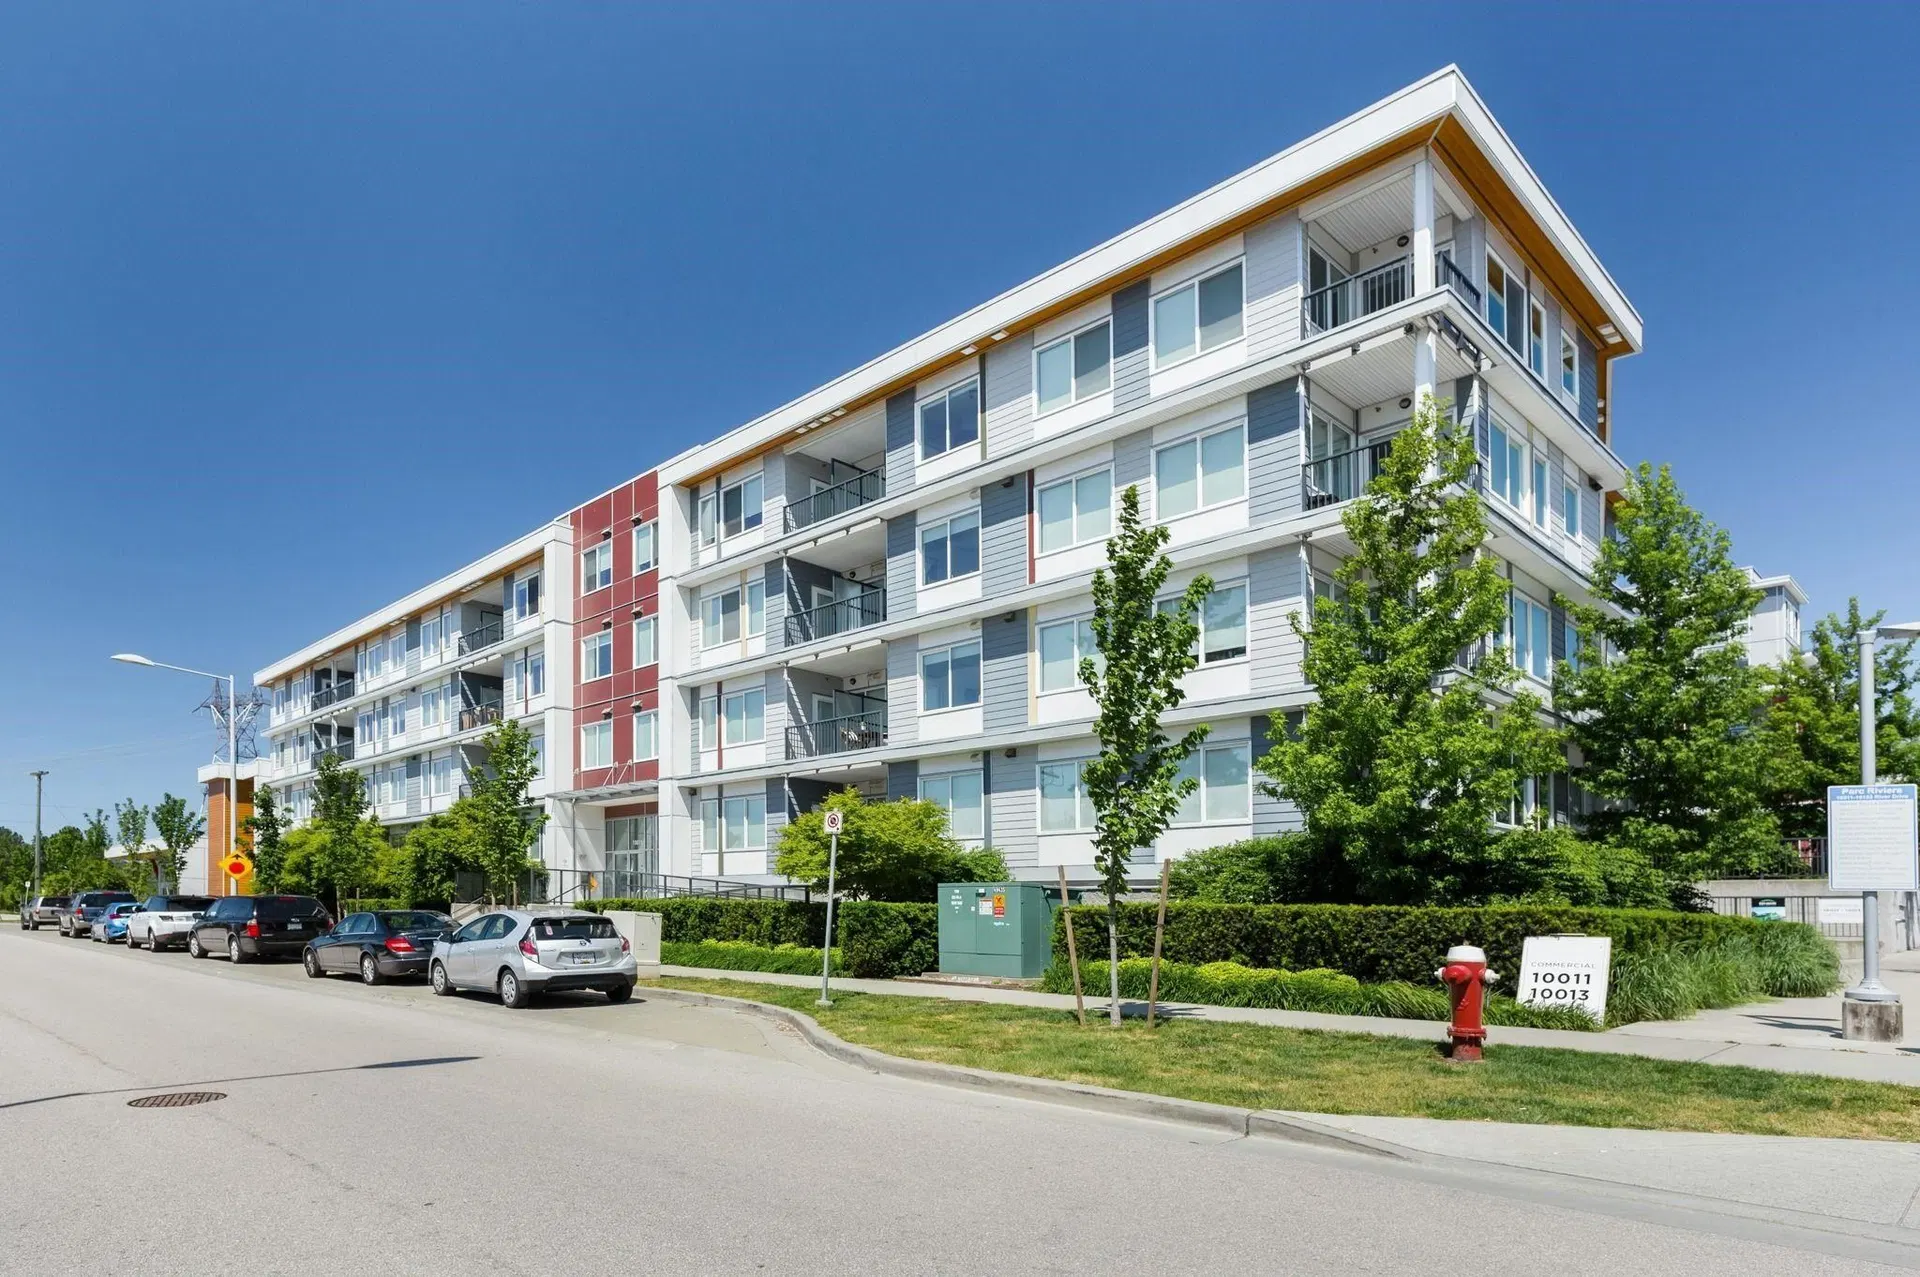
$699,000
$870/sqft
2 bd · 2 ba · 803 sqft
#317, 10011 River Drive
Richmond · Apartment/Condo
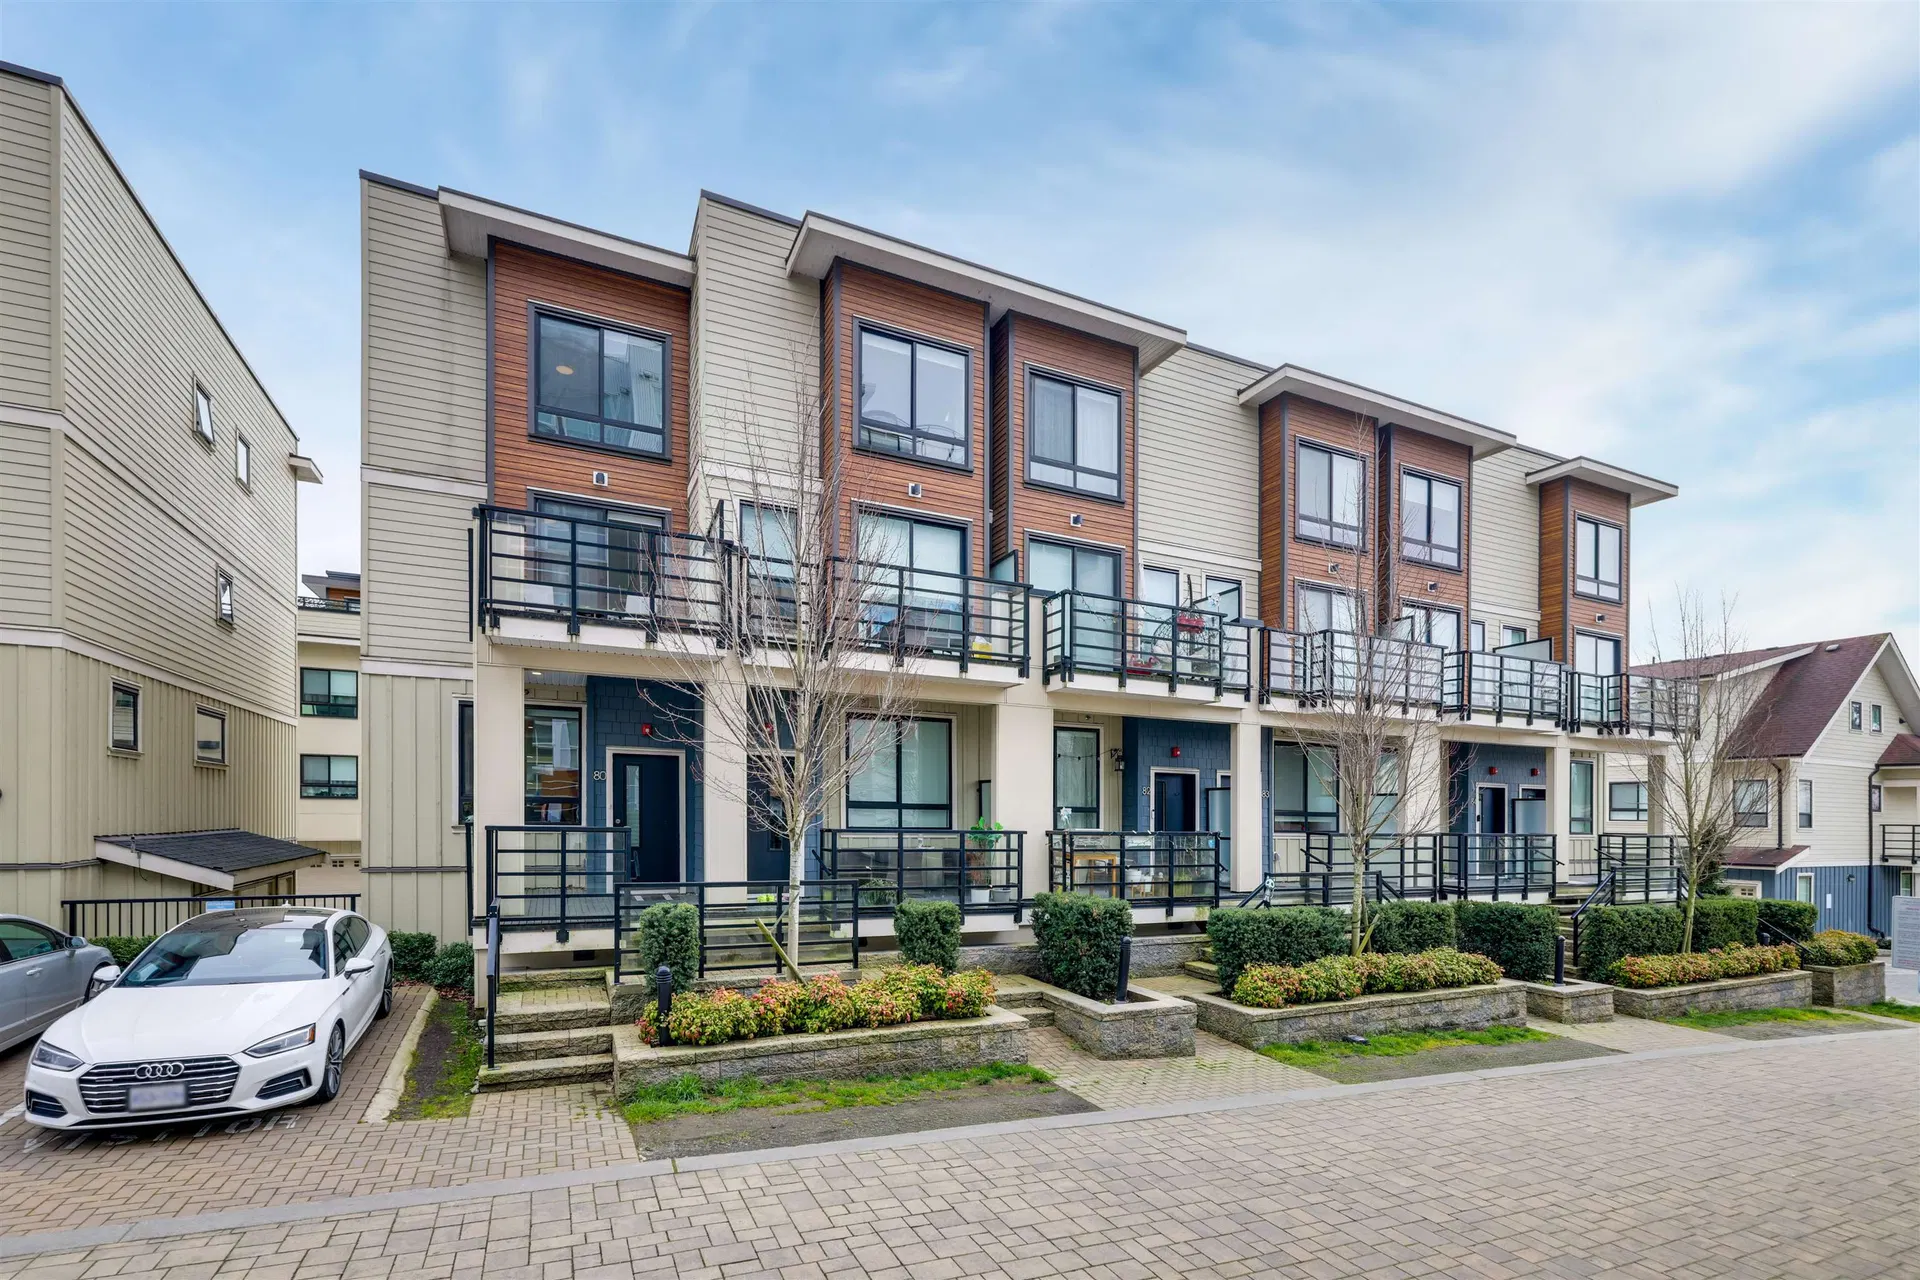
$1,200,000
$674/sqft
4 bd · 4 ba · 1,780 sqft
#80, 10199 River Drive
Richmond · Townhouse

$1,148,800
$854/sqft
3 bd · 3 ba · 1,345 sqft
#61, 10199 River Drive
Richmond · Townhouse
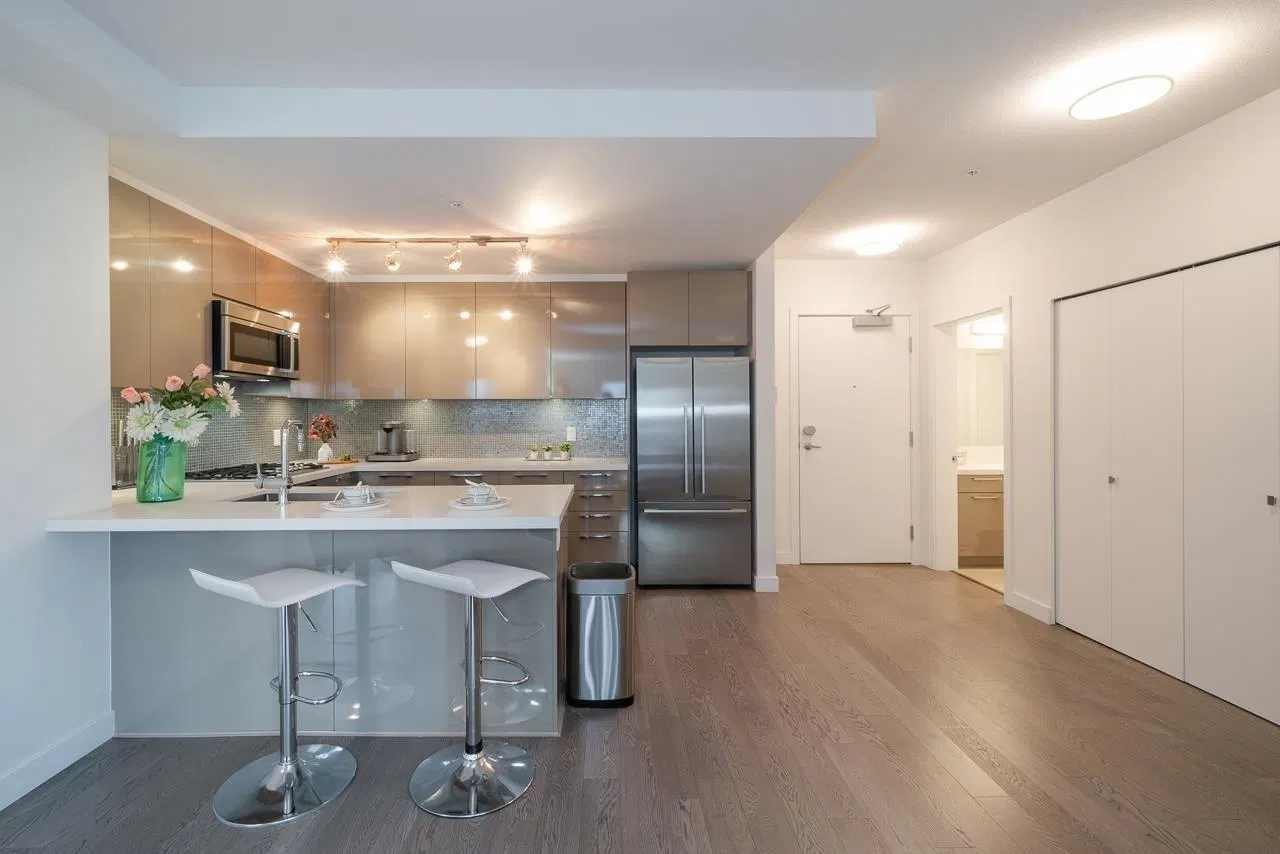
$799,000
$670/sqft
3 bd · 2 ba · 1,192 sqft
#218, 10177 River Drive
Richmond · Apartment/Condo

$499,999
$739/sqft
2 bd · 1 ba · 677 sqft
#509, 10011 River Drive
Richmond · Apartment/Condo

$1,089,000
$816/sqft
3 bd · 3 ba · 1,335 sqft
#28, 10233 River Drive
Richmond · Townhouse
NOTE: This representation is based in whole or in part on data generated by the Chilliwack & District Real Estate Board, Fraser Valley Real Estate Board or Real Estate Board of Greater Vancouver which assumes no responsibility for its accuracy. The information contained on this site is based in whole or in part on information that is provided by members of The Canadian Real Estate Association (CREA), who are responsible for its accuracy. CREA reproduces and distributes this information as a service for its members and assumes no responsibility for its accuracy. MLS®, Multiple Listing Service®, and REALTOR® are trademarks of the Canadian Real Estate Association (CREA).
Saved search
Get new listings that fit, by email.
Townhouse listings make up 44% of what is for sale in Bridgeport RI (14 of 32 listings), with a median asking price of $1.12M. Condo / Apartment listings are next at 31%, typically asking $638K. The gap between property types is real money here: a typical condo asks $638K while a typical detached home asks $1.55M.
For context across Richmond: Brighouse (median $749K), West Cambie (median $788K), Brighouse South (median $598K). Bridgeport RI carries the highest median asking price of this group. Comparing a few adjacent areas is often the fastest way to see whether a listing is priced with its street or against it.
Townhouses lead the market in Bridgeport RI, at 44% of active listings. That is the ground-oriented middle: more room than an apartment, less upkeep than a house.
The next largest group is condos, at 31% of what is listed.
Construction dates are spread out. The median home for sale dates to 2015, with most of the market falling between 1989 and 2020, so condition and updates vary a lot from listing to listing.
The 3-bedroom plan is the most common listing, with smaller and larger homes on either side of it.
A typical listing here offers about 1,335 sq ft of living space and 3 bathrooms.
Enclosed parking is standard: 91% of listings include a garage.
75% of the active listings are strata-titled and the rest are freehold, so the ownership question is a live one in Bridgeport RI rather than settled by the neighbourhood.
Across the 24 listings that disclose one, the median strata fee is $600 per month. Read it against what it covers before comparing two buildings on price alone.
Transit coverage is thin here. Most listings in Bridgeport RI are not close to rapid transit or a frequent bus route, so plan on driving.
Across 31 scored listings the median walk score is 31 out of 100, computed from real walking routes. Day-to-day errands here usually involve a drive or a bus.
Cycling scores better than walking in a lot of the city, and it does here too: the median bike score across scored listings is 72.
31% of the current listings are waterfront, which is rare enough anywhere in the region to shape pricing on the streets around them.
A view is claimed on 50% of the listings. Views are priced aggressively and are the first thing a new tower can take away, so it is worth checking what protects one before you pay for it.
Written and maintained by Ray Rasouli, REALTOR®, licensed in British Columbia and founder of Relta Real Estate.
Source: MLS® listing data from BC real estate boards (MLS® Reciprocity) and CREA's DDF®. Figures are asking prices on active MLS® listings filed under this MLS® area. They are not sold prices.
NOTE: This representation is based in whole or in part on data generated by the Chilliwack & District Real Estate Board, Fraser Valley Real Estate Board or Real Estate Board of Greater Vancouver which assumes no responsibility for its accuracy. The information contained on this site is based in whole or in part on information that is provided by members of The Canadian Real Estate Association (CREA), who are responsible for its accuracy. CREA reproduces and distributes this information as a service for its members and assumes no responsibility for its accuracy. MLS®, Multiple Listing Service®, and REALTOR® are trademarks of the Canadian Real Estate Association (CREA).