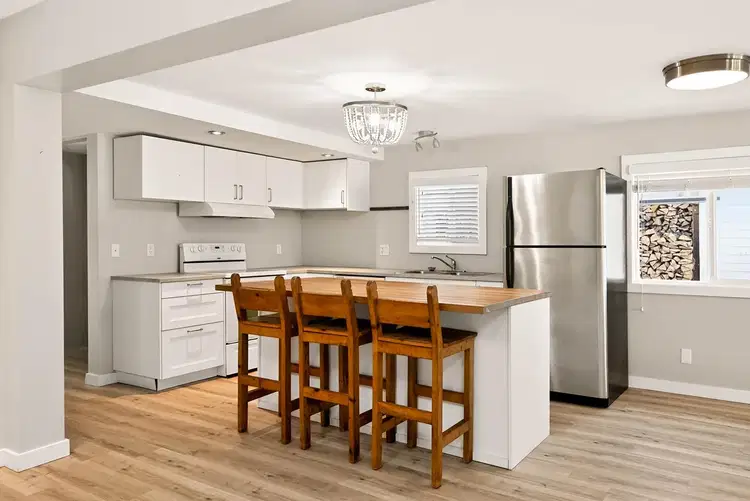
35
$284,000
$261/sqft
3 bd · 1 ba · 1,088 sqft
#27, 1413 Sunshine Coast Highway
Gibsons · Manufactured Home
Listed by RE/MAX City RealtyMLS® R3172733
Gibsons affordability
The median home in Gibsons asks $949,000. With 20% down, most buyers need about $175,000 a year. Enter your numbers below.
Source: 2021 Census and current MLS® asking prices.
Your numbers
$
$
$
Price you can likely afford
Up to $375,000
A payment of $1,521 a month at 4.49%, tested at 6.49%.
An estimate, not a pre-approval.
Source: 2021 Census and current MLS® asking prices.
Open these Gibsons homes on the map
Draw an area and save homes you like.
$284,000
$261/sqft
3 bd · 1 ba · 1,088 sqft
#27, 1413 Sunshine Coast Highway
Gibsons · Manufactured Home
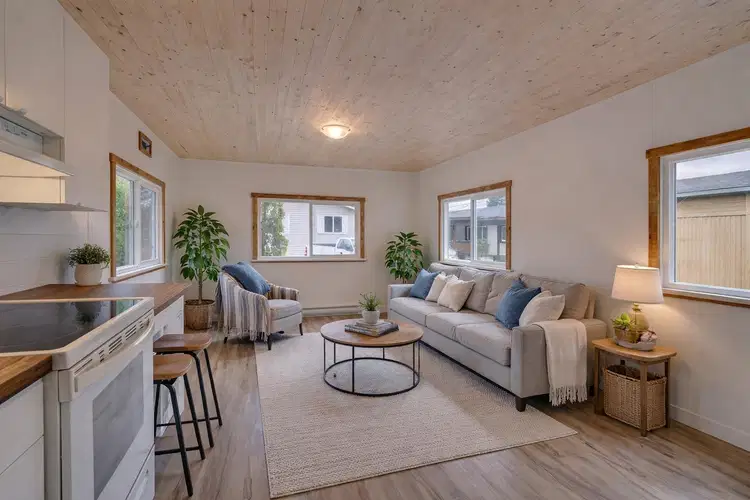
$225,000
$333/sqft
2 bd · 1 ba · 675 sqft
#28, 1413 Sunshine Coast Highway
Gibsons · Manufactured Home
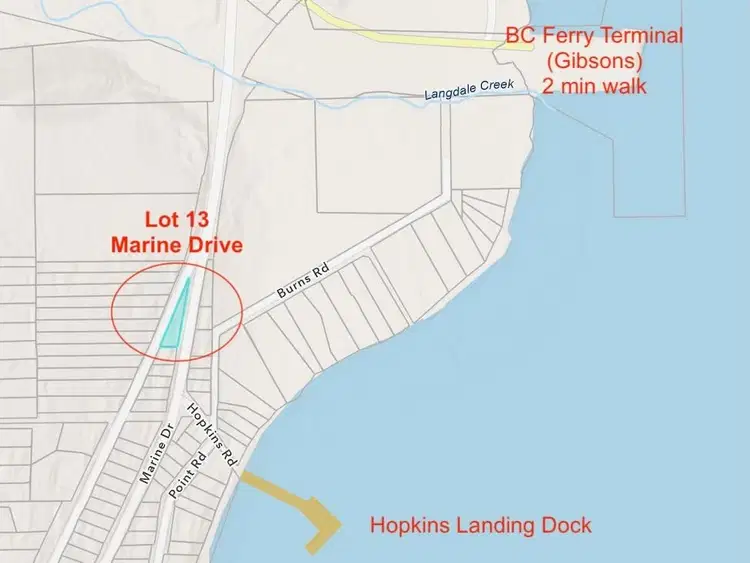
$329,000
LOT 13 Marine Drive
Gibsons · Land
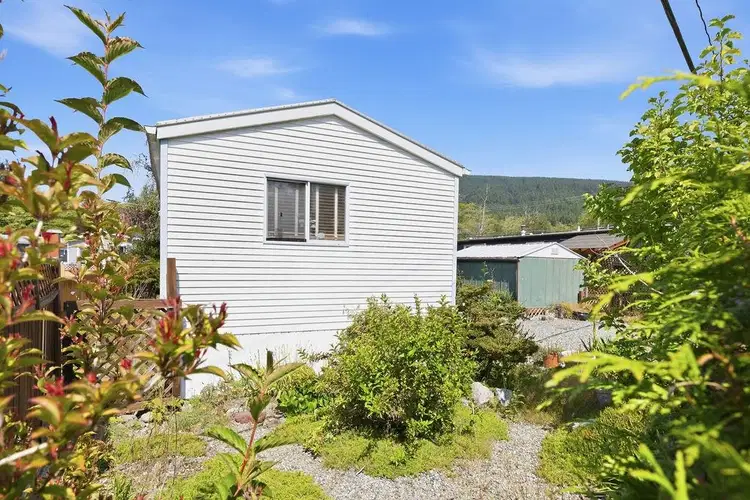
$199,000
$261/sqft
2 bd · 1 ba · 763 sqft
#7, 1413 Sunshine Coast Highway
Gibsons · Manufactured Home
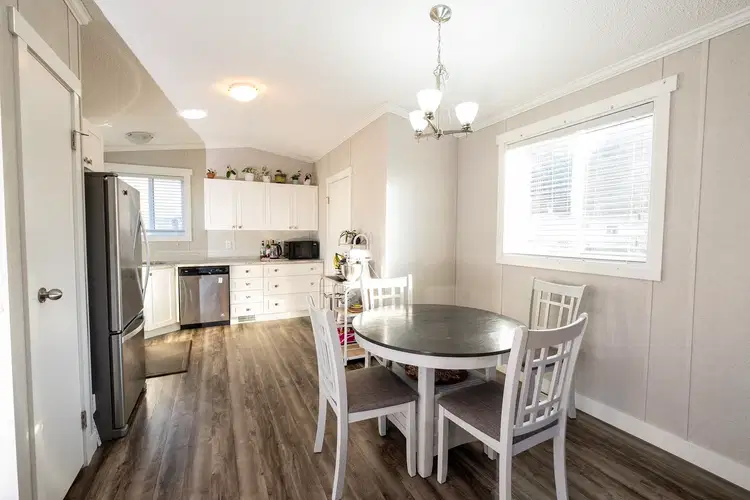
$329,000
$332/sqft
2 bd · 2 ba · 990 sqft
#139, 1413 Sunshine Coast Highway
Gibsons · Manufactured Home
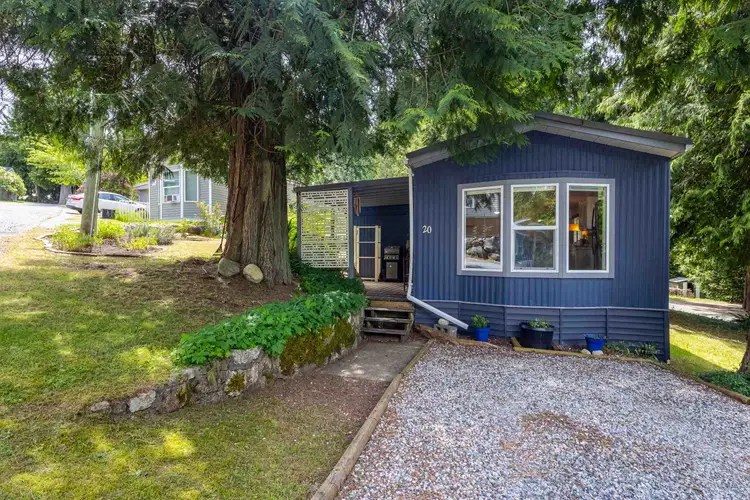
$289,000
$304/sqft
3 bd · 1 ba · 950 sqft
#20, 1416 North Road
Gibsons · Manufactured Home
NOTE: This representation is based in whole or in part on data generated by the Chilliwack & District Real Estate Board, Fraser Valley Real Estate Board or Real Estate Board of Greater Vancouver which assumes no responsibility for its accuracy. The information contained on this site is based in whole or in part on information that is provided by members of The Canadian Real Estate Association (CREA), who are responsible for its accuracy. CREA reproduces and distributes this information as a service for its members and assumes no responsibility for its accuracy. MLS®, Multiple Listing Service®, and REALTOR® are trademarks of the Canadian Real Estate Association (CREA).
Saved search
Get new listings that fit, by email.
At least 5% of the first $500,000 and 10% of the rest, and 20% from $1.50M.
Lenders test you at your rate plus two points, or 5.25% if higher. Here that is 6.49%.
Housing can take up to 39% of income before tax, and housing plus other debts up to 44%.
Median asking price with 20% down, tested at 6.49%.
| City | Median asking | Income needed | Median income | Price to income |
|---|---|---|---|---|
| West Vancouver | $2,998,000 | $531,000 | $104,000 | 28.8x |
| Whistler | $1,749,000 | $314,000 | $99,000 | 17.7x |
| Vancouver | $1,349,900 | $244,000 | $82,000 | 16.5x |
| White Rock | $1,129,500 | $206,000 | $73,000 | 15.5x |
| Duncan | $799,900 | $149,000 | $53,200 | 15x |
| Gibsons | $949,000 | $175,000 | $70,000 | 13.6x |
| Richmond | $1,048,800 | $192,000 | $79,000 | 13.3x |
| Saanich | $1,099,000 | $201,000 | $93,000 | 11.8x |
| Delta | $1,260,000 | $229,000 | $108,000 | 11.7x |
| Parksville | $768,075 | $143,000 | $66,500 | 11.6x |
| Qualicum Beach | $870,000 | $161,000 | $76,500 | 11.4x |
| Sechelt | $799,000 | $149,000 | $73,500 | 10.9x |
| Victoria | $722,000 | $135,000 | $67,500 | 10.7x |
| Oliver | $735,000 | $138,000 | $68,500 | 10.7x |
| North Vancouver | $1,298,000 | $235,000 | $123,000 | 10.6x |
| Coquitlam | $965,900 | $178,000 | $92,000 | 10.5x |
| Maple Ridge | $1,100,000 | $201,000 | $105,000 | 10.5x |
| Hope | $663,000 | $125,000 | $64,000 | 10.4x |
| Burnaby | $858,000 | $159,000 | $83,000 | 10.3x |
| Surrey | $999,900 | $184,000 | $98,000 | 10.2x |
| Courtenay | $735,000 | $138,000 | $72,000 | 10.2x |
| Lake Country | $980,000 | $180,000 | $98,000 | 10x |
| Port Moody | $1,098,000 | $201,000 | $115,000 | 9.5x |
| Kelowna | $769,999 | $144,000 | $82,000 | 9.4x |
| Squamish | $1,029,000 | $189,000 | $111,000 | 9.3x |
| Langley | $989,850 | $182,000 | $108,000 | 9.2x |
| Penticton | $625,000 | $119,000 | $68,000 | 9.2x |
| Summerland | $750,000 | $140,000 | $82,000 | 9.1x |
| Abbotsford | $799,900 | $149,000 | $90,000 | 8.9x |
| Nanaimo | $675,000 | $127,000 | $75,500 | 8.9x |
| Mission | $875,000 | $162,000 | $98,000 | 8.9x |
| Chilliwack | $749,900 | $140,000 | $85,000 | 8.8x |
| Port Coquitlam | $899,444 | $166,000 | $102,000 | 8.8x |
| Salmon Arm | $659,000 | $124,000 | $75,000 | 8.8x |
| Sooke | $779,900 | $145,000 | $90,000 | 8.7x |
| Port Alberni | $539,900 | $104,000 | $62,800 | 8.6x |
| New Westminster | $699,000 | $131,000 | $82,000 | 8.5x |
| Vernon | $620,000 | $118,000 | $73,500 | 8.4x |
| Campbell River | $649,900 | $123,000 | $78,000 | 8.3x |
| Powell River | $545,000 | $105,000 | $67,000 | 8.1x |
| Langford | $699,900 | $132,000 | $93,000 | 7.5x |
| Kamloops | $639,900 | $121,000 | $88,000 | 7.3x |
| West Kelowna | $725,000 | $136,000 | $99,000 | 7.3x |
| Osoyoos | $449,000 | $88,000 | $66,000 | 6.8x |
| Merritt | $379,950 | $76,000 | $70,000 | 5.4x |
| Quesnel | $325,000 | $66,000 | $67,000 | 4.9x |
| Prince George | $394,000 | $78,000 | $88,000 | 4.5x |
| Dawson Creek | $362,500 | $73,000 | $81,000 | 4.5x |
| Fort St. John | $386,950 | $77,000 | $102,000 | 3.8x |
The median asking price in Gibsons is $949,000. At the minimum down payment of $69,900, the mortgage would be $879,100, and the payment about $4,861 a month over 25 years.
Lenders do not qualify you at that rate. Under the stress test the same mortgage is assessed at about $5,883 a month, which is the figure that decides whether the loan is approved.
Households in Gibsons earn a median of $70,000, so the median home asks 13.6 times a full year of household income before tax.
That payment alone would take about 83% of median gross household income, before property tax, strata fees, insurance, heat or anything else a home costs to run.
31% of Gibsons households already spend more than 30% of income on shelter, which is the line Statistics Canada uses to call housing unaffordable.
Against the rest of the province, where the median city sits at about 9.3 times income, Gibsons is 4.3 points higher.
What the payment figures assume
At the $949,000 median asking price, with 20% down and no other debt, about $175,000 a year in household income. These are examples, not a quote or an approval.
The median Gibsons home costs 13.6 times the median yearly household income. 31% of local households spend more than 30% of income on housing.
Borrowing costs
The rates behind every payment estimate on this site.
These are benchmark rates, not mortgage quotes. Your rate depends on the lender, the term, and your file.
Source: Bank of Canada. As of 2026-10-29
Written and maintained by Ray Rasouli, REALTOR®, licensed in British Columbia and founder of Relta Real Estate.
Source: Statistics Canada 2021 Census and BCRES MLS® listings.
NOTE: This representation is based in whole or in part on data generated by the Chilliwack & District Real Estate Board, Fraser Valley Real Estate Board or Real Estate Board of Greater Vancouver which assumes no responsibility for its accuracy. The information contained on this site is based in whole or in part on information that is provided by members of The Canadian Real Estate Association (CREA), who are responsible for its accuracy. CREA reproduces and distributes this information as a service for its members and assumes no responsibility for its accuracy. MLS®, Multiple Listing Service®, and REALTOR® are trademarks of the Canadian Real Estate Association (CREA).
Payment figures are examples at an illustrative rate, not a rate quote, an approval, or financial advice.