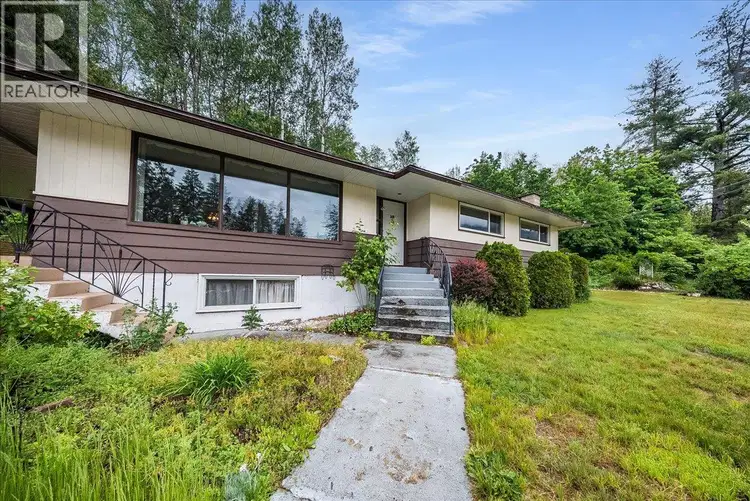
79Strong value
$399,000
$175/sqft
3 bd · 2 ba · 2,274 sqft
Castlegar
30.8% below 22 comps · median $253/sqft
Highest scoring of 26 scored in Castlegar
Listed by eXp RealtyMLS® 10391218
Kootenays & the Rockies · scored nightly
26 Castlegar listings score 55 or higher against similar listings. 2 of them score 75 or higher (about 8%).
Get an email when a Castlegar listing cuts its price or a new one comes on.
$399,000
$175/sqft
3 bd · 2 ba · 2,274 sqft
Castlegar
30.8% below 22 comps · median $253/sqft
Highest scoring of 26 scored in Castlegar
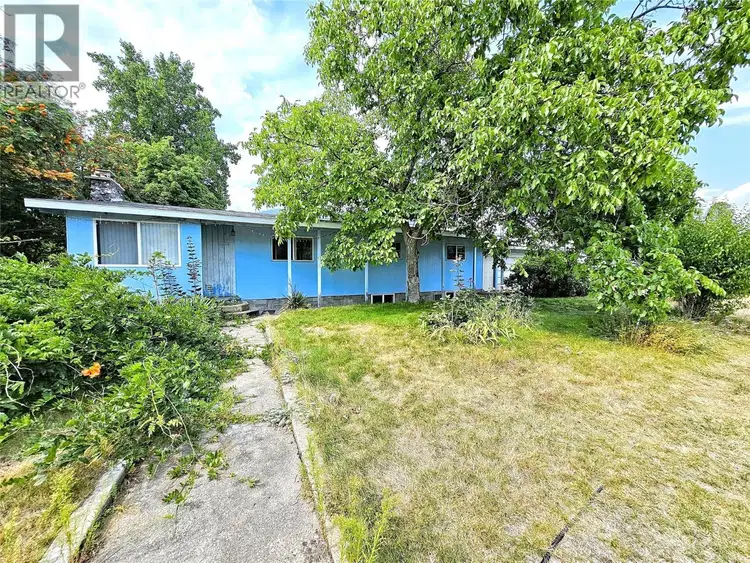
$449,900
$184/sqft
3 bd · 2 ba · 2,447 sqft
Castlegar
34% below 24 comps · median $278/sqft
Top 8% of 26 scored in Castlegar
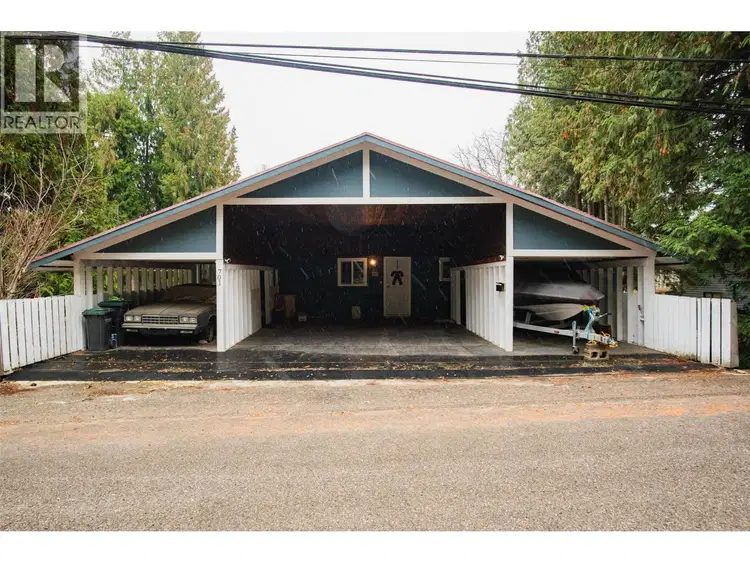
$649,000
$210/sqft
6 bd · 3 ba · 3,090 sqft
Castlegar
23.6% below 6 comps · median $275/sqft
Top 12% of 26 scored in Castlegar
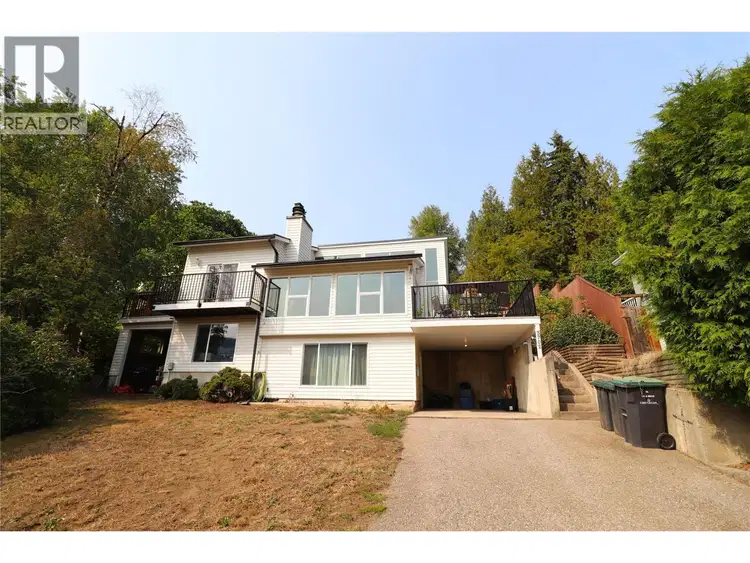
$489,000
$233/sqft
3 bd · 2 ba · 2,100 sqft
Castlegar
21.3% below 22 comps · median $296/sqft
Top 16% of 26 scored in Castlegar
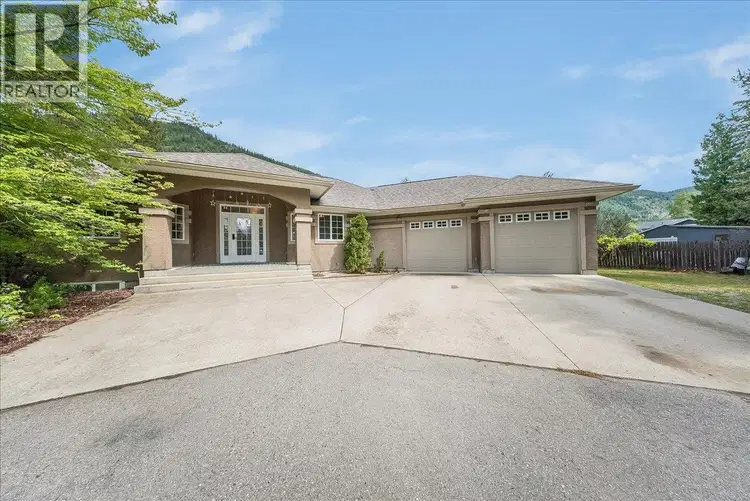
$895,000
$214/sqft
5 bd · 4 ba · 4,180 sqft
Castlegar
19.5% below 8 comps · median $266/sqft
Top 20% of 26 scored in Castlegar
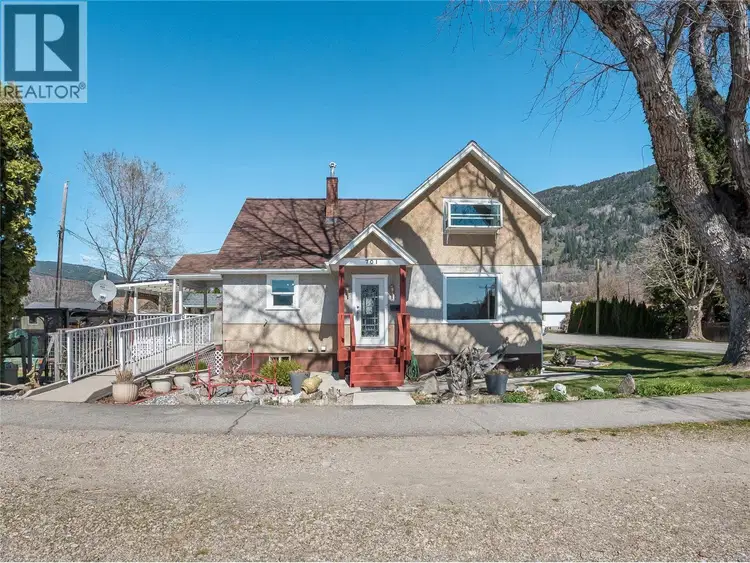
$419,900
$216/sqft
3 bd · 2 ba · 1,941 sqft
Castlegar
14.7% below 18 comps · median $253/sqft
Top 24% of 26 scored in Castlegar
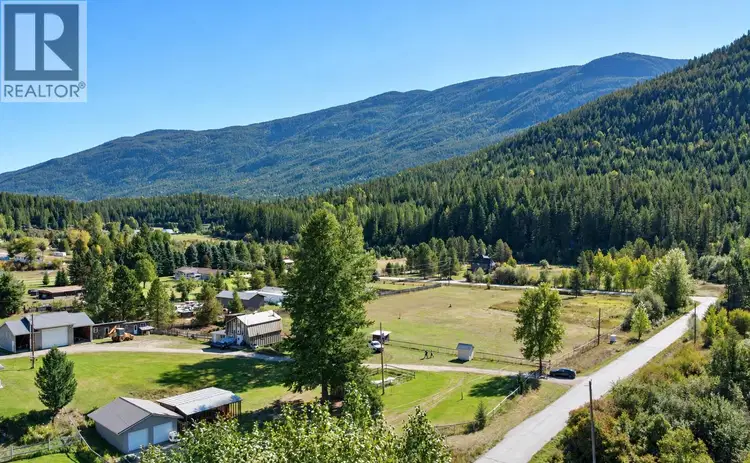
$479,000
$316/sqft
1 bd · 1 ba · 1,518 sqft
Castlegar
20.1% below 16 comps · median $395/sqft
7 of 26 scored in Castlegar
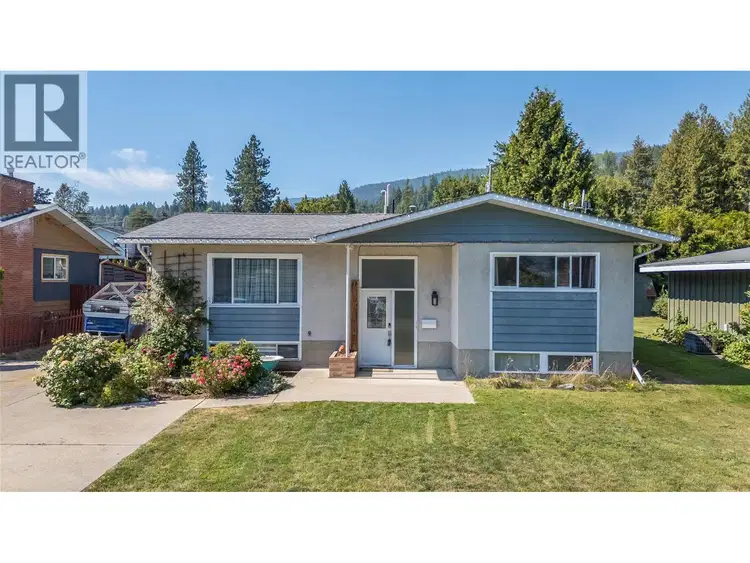
$554,000
$229/sqft
5 bd · 3 ba · 2,420 sqft
Castlegar
18% below 25 comps · median $279/sqft
8 of 26 scored in Castlegar
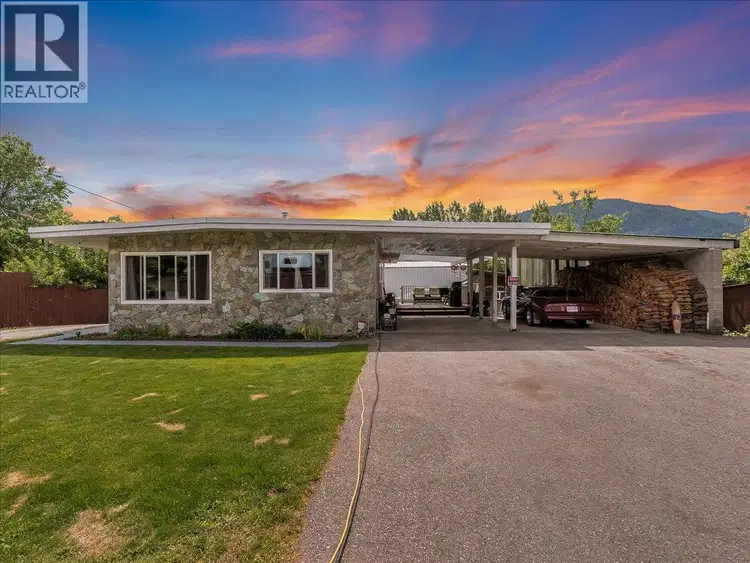
$709,900
$253/sqft
4 bd · 3 ba · 2,808 sqft
Castlegar
13.7% below 13 comps · median $293/sqft
9 of 26 scored in Castlegar
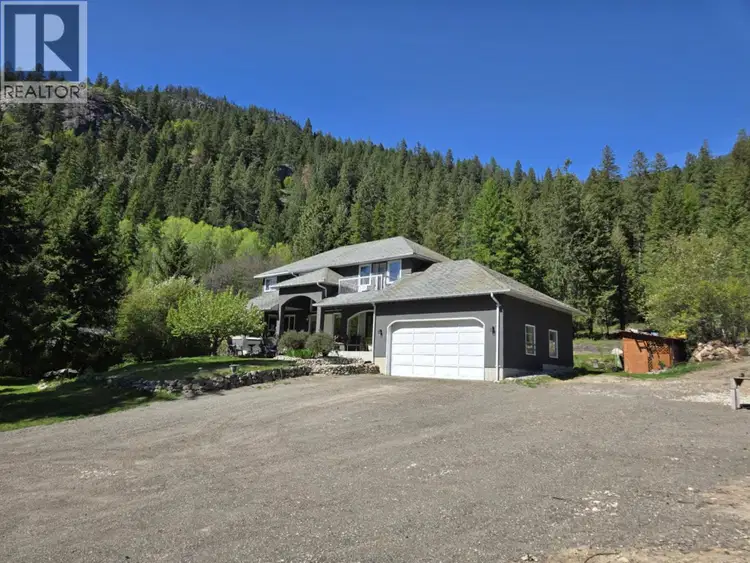
$779,000
$217/sqft
4 bd · 4 ba · 3,582 sqft
Castlegar
19.3% below 22 comps · median $270/sqft
10 of 26 scored in Castlegar
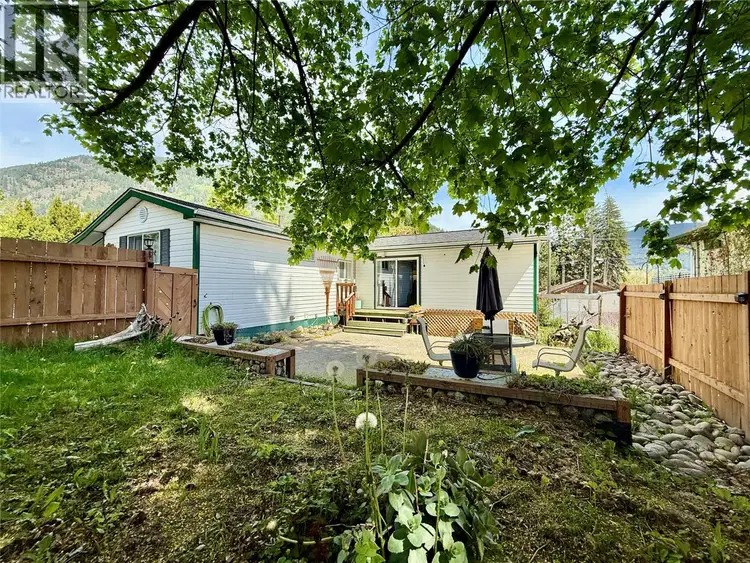
$470,000
$225/sqft
3 bd · 2 ba · 2,093 sqft
Castlegar
11.4% below 18 comps · median $253/sqft
11 of 26 scored in Castlegar
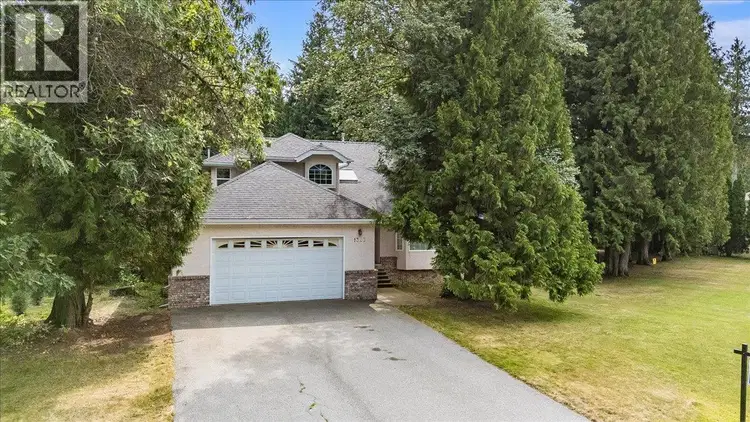
$650,000
$238/sqft
5 bd · 4 ba · 2,732 sqft
Castlegar
15.5% below 24 comps · median $281/sqft
12 of 26 scored in Castlegar
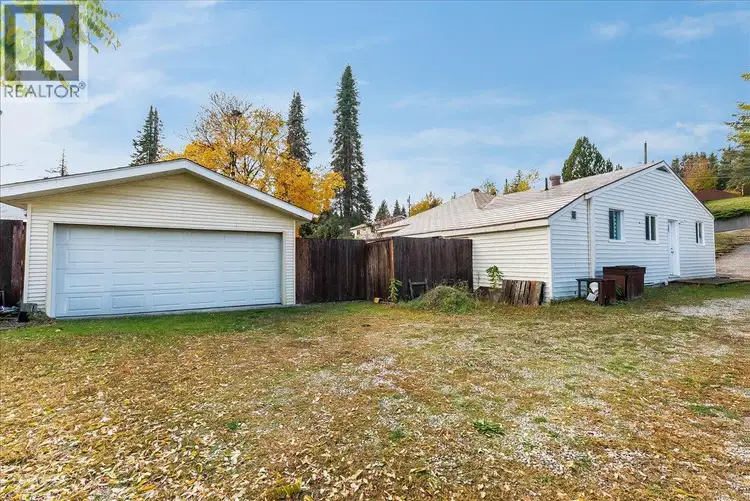
$459,900
$303/sqft
3 bd · 1 ba · 1,520 sqft
Castlegar
17.4% below 14 comps · median $366/sqft
13 of 26 scored in Castlegar
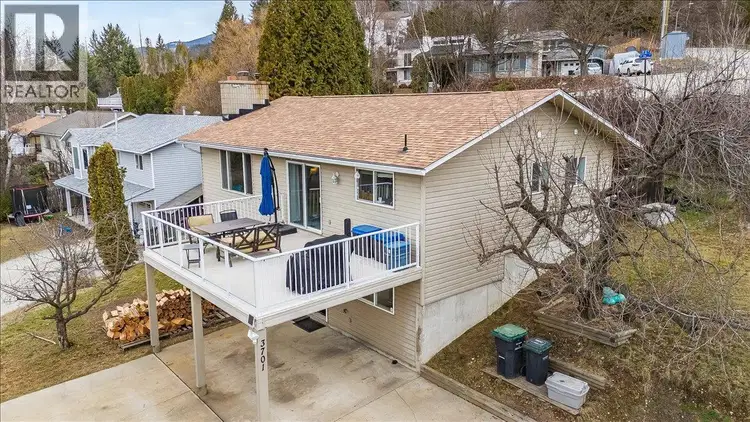
$559,900
$246/sqft
4 bd · 3 ba · 2,274 sqft
Castlegar
13.2% below 25 comps · median $284/sqft
14 of 26 scored in Castlegar
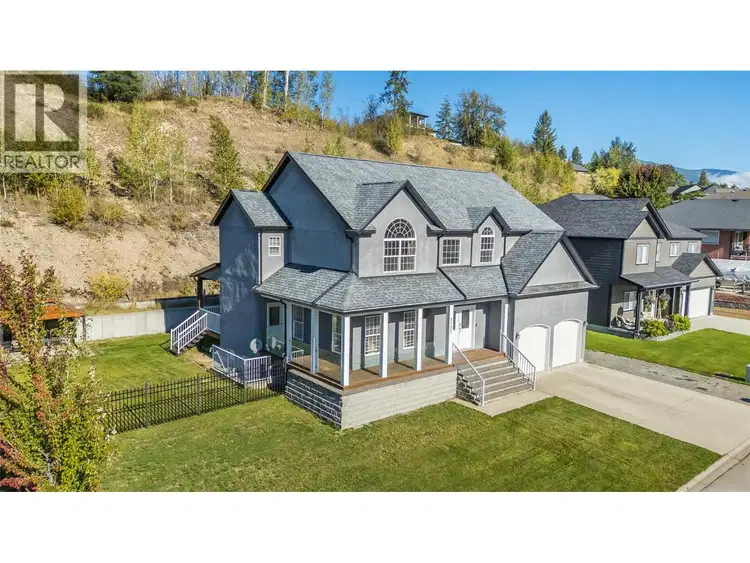
$899,900
$242/sqft
5 bd · 4 ba · 3,720 sqft
Castlegar
9.1% below 6 comps · median $266/sqft
15 of 26 scored in Castlegar
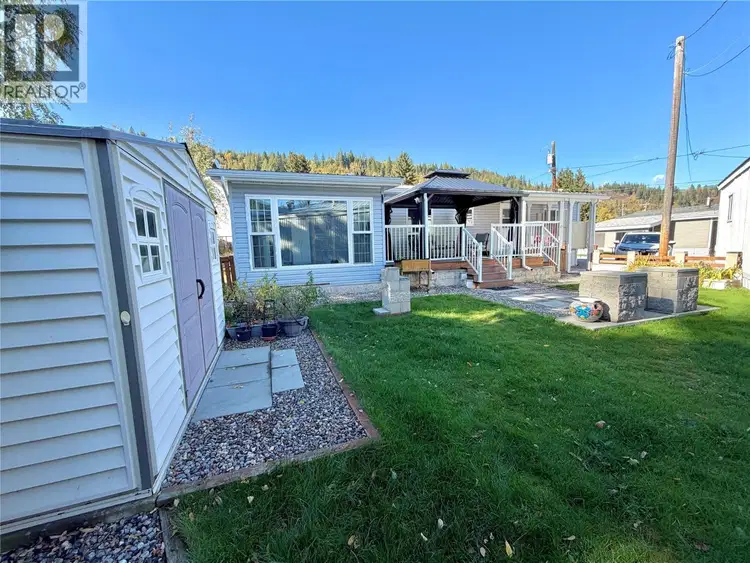
$164,900
$227/sqft
2 bd · 1 ba · 728 sqft
Castlegar
16.7% below 6 comps · median $272/sqft
16 of 26 scored in Castlegar
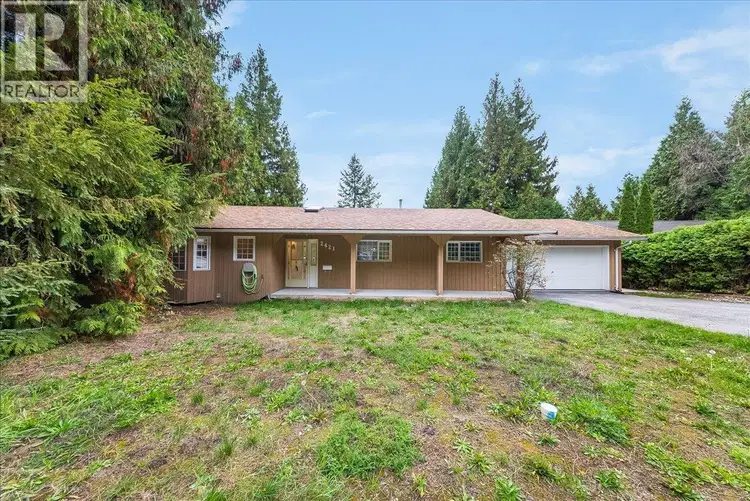
$570,000
$244/sqft
4 bd · 4 ba · 2,340 sqft
Castlegar
12.7% below 25 comps · median $279/sqft
17 of 26 scored in Castlegar
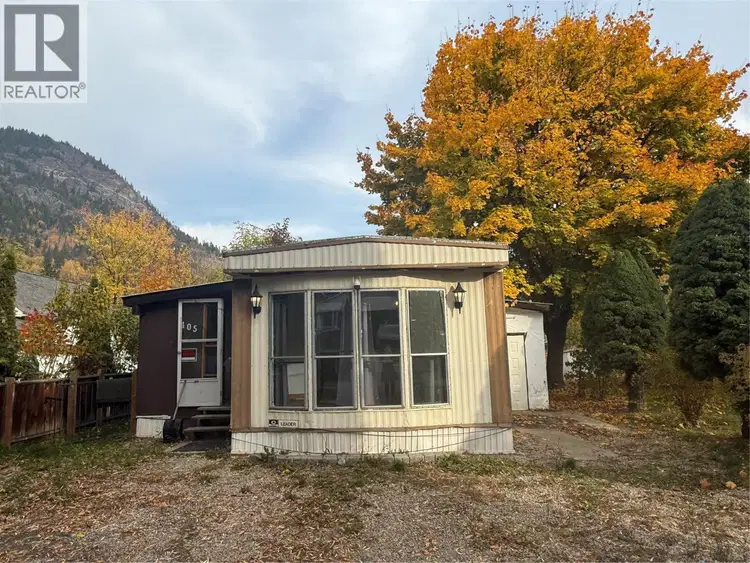
$225,000
$244/sqft
2 bd · 1 ba · 924 sqft
Castlegar
18.9% below 9 comps · median $300/sqft
18 of 26 scored in Castlegar
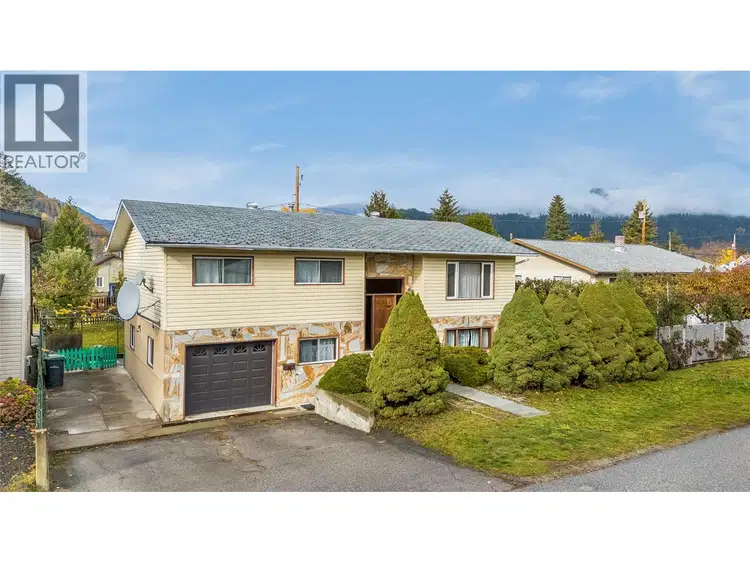
$540,000
$228/sqft
4 bd · 3 ba · 2,371 sqft
Castlegar
10.3% below 23 comps · median $254/sqft
19 of 26 scored in Castlegar
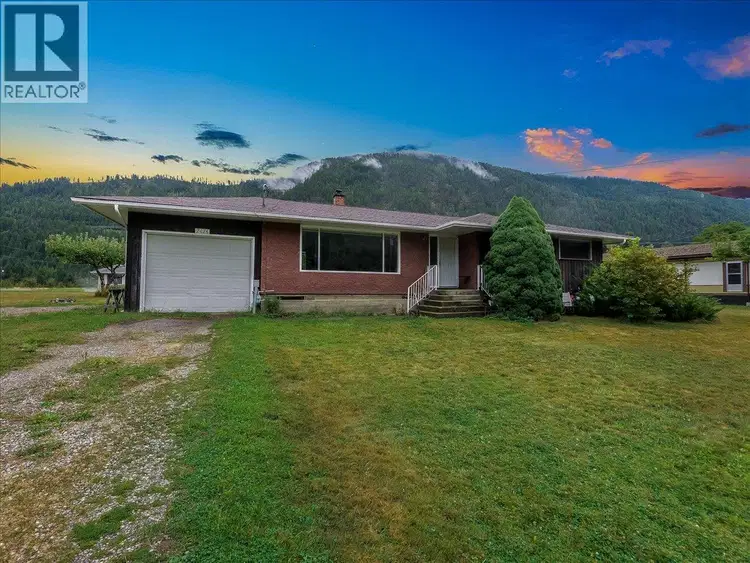
$559,000
$289/sqft
5 bd · 2 ba · 1,936 sqft
Castlegar
13.2% below 24 comps · median $333/sqft
20 of 26 scored in Castlegar
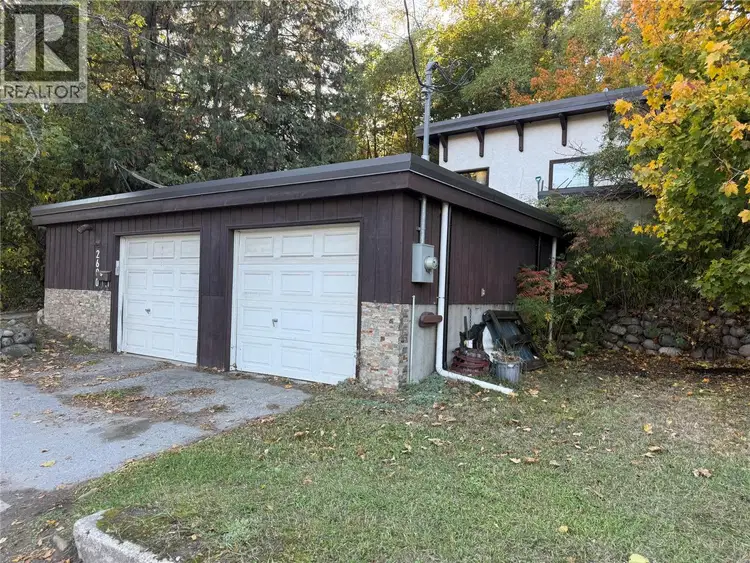
$420,000
$310/sqft
3 bd · 1 ba · 1,357 sqft
Castlegar
10.8% below 14 comps · median $347/sqft
21 of 26 scored in Castlegar
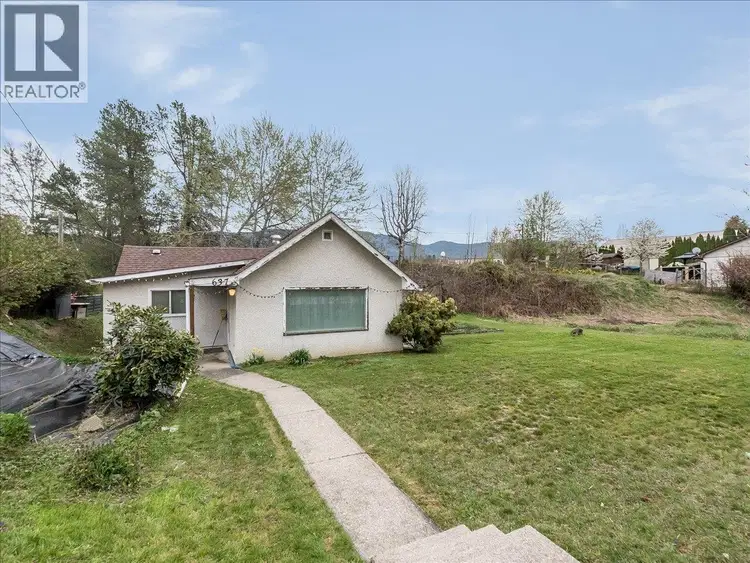
$329,000
$307/sqft
3 bd · 1 ba · 1,072 sqft
Castlegar
12.3% below 6 comps · median $350/sqft
22 of 26 scored in Castlegar
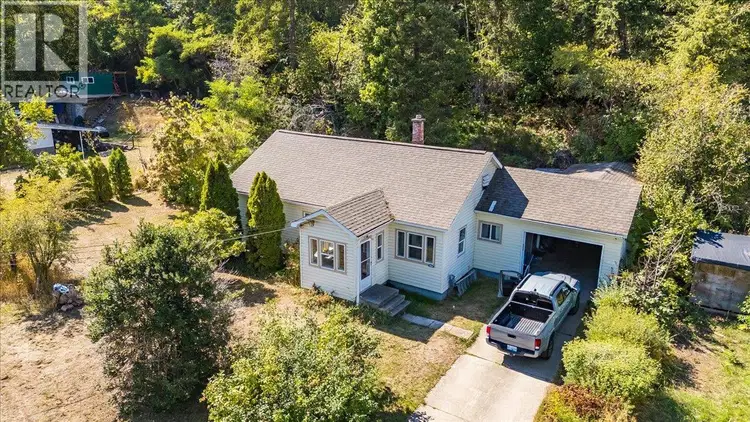
$424,000
$324/sqft
3 bd · 1 ba · 1,310 sqft
Castlegar
11.6% below 12 comps · median $366/sqft
23 of 26 scored in Castlegar
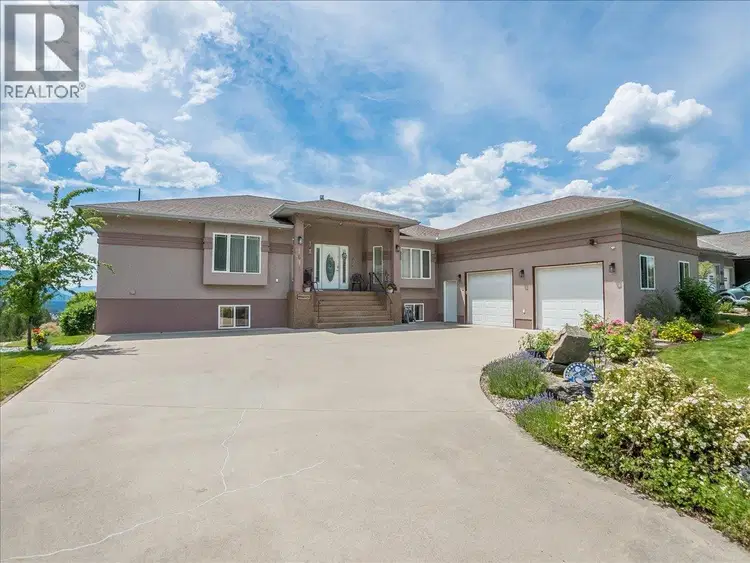
$1,099,000
$256/sqft
4 bd · 6 ba · 4,290 sqft
Castlegar
13.1% below 9 comps · median $295/sqft
24 of 26 scored in Castlegar
Saved search
Get new listings that fit, by email.
Castlegar households earn a median of $81,000 a year, and owners here carry a median shelter cost of $1,060 a month, about 16% of that income before tax.
14% of Castlegar households already spend more than 30% of their income on shelter, which is the line Statistics Canada uses to call housing unaffordable.
Owners hold 76% of Castlegar homes and renters the other 24%.
The census valued the average Castlegar dwelling at $428,000 in 2021. The median asking price among the listings scored here is $547,000, 28% above that figure. Census values are self-reported and four years old, so read the gap as context rather than a measure of the market today.
Source: Statistics Canada, 2021 Census of Population, census subdivision level.
Each listing is scored out of 100 against similar listings in its own city. No listing can pay to appear.
A score compares an asking price with comparable listings. It does not look inside the home, it is not an appraisal, and it is not financial advice.
Written and maintained by Ray Rasouli, REALTOR®, licensed in British Columbia and founder of Relta Real Estate.
Source: MLS® listing data from BC real estate boards (MLS® Reciprocity) and CREA's DDF®.
NOTE: This representation is based in whole or in part on data generated by the Chilliwack & District Real Estate Board, Fraser Valley Real Estate Board or Real Estate Board of Greater Vancouver which assumes no responsibility for its accuracy. The information contained on this site is based in whole or in part on information that is provided by members of The Canadian Real Estate Association (CREA), who are responsible for its accuracy. CREA reproduces and distributes this information as a service for its members and assumes no responsibility for its accuracy. MLS®, Multiple Listing Service®, and REALTOR® are trademarks of the Canadian Real Estate Association (CREA).
Source: BCRES MLS® via Bridge Interactive. Scores update nightly.